March 3, 2014
Posted in business, Capital, cost of living, Economic Growth, Economy, Federal Reserve, generation, government, income gap, industrial economy, Inflation, investment advisor, investment banking, investments, job market, labor force, Labor Market, large business, medicare/medicaid, National Federation of Independent Business's, revenue, Robert Barone, small business, social media, social security, taxes, Unemployment, wages, Wall Street at 8:31 PM by Robert Barone
It is not the strongest of the species that survives, nor the most intelligent, but the one most responsive to change.– Charles Darwin
I am often asked: “When do you think the economy will return to normal?”
My response: If by “normal” you mean what we had from the 1980s to 2008 — the “if you build it, they will come” economy — the answer is, not anytime in the foreseeable future.
The economic environment has permanently changed, and businesses that don’t adapt to the new environment will become extinct like dinosaurs. Think about Kodak and Polaroid. They were big, strong and probably smart, but they didn’t adapt.
Slower Growth
In the new business environment, economic growth will be much harder to achieve, the income gap will continue to grow and bigger and more intrusive governments at all levels will demand more revenue.
In mid-February, the Congressional Budget Office concluded that potential economic growth for at least the next 10 years will be much lower than what we have experienced for the last few decades. They attribute this to the health system known as Obamacare as well as disincentives to work.
A Growing Income Gap
The growing income gap is well documented. What’s not well documented are the causes.
There are two major ones starting with government policy. Federal Reserve money printing, for example, benefits the most affluent and Wall Street’s financial institutions. Government policy to under-report inflation (which began in earnest in 1994) reduces budget deficits by limiting payouts to Social Security and Medicare recipients and saves interest costs on the debt. But it has kept wage rates from keeping pace with inflation.
If inflation has been understated by just three percentage points per year since 1994, then wage earners, who have only received “cost of living” adjustments, have lost 55% of their purchasing power. No wonder both spouses have to work (some with two jobs) and still have a hard time making ends meet.
But, there is another factor at play here. In the Industrial Revolution, innovation benefited all workers. It wasn’t hard for workers with little formal education to learn how to operate machine tools, and they could master skills needed in the new industrial economy.
But, that is not true today. In fact, the National Federation of Independent Business’s surveys have for some time now shown an increasing trend that businesses cannot find the skills they need. As a result, jobs go unfilled. The jobs that are available require skills only learned through and intensive educational process, such as majoring in engineering or computer science at a university.
These are the folks who are getting the high paying jobs. Those with few or no skills must take much lower-paying service type or minimum wage jobs. In the latest unemployment survey, the unemployment rate among college graduates was 3.3%, for those with high school degrees it was 7.3%, and for those with less than a high school diploma, it was 11.1%. Thus, it appears that the nature of the new technology revolution is also contributing to the income gap.
Other Endemic Factors
For the past five years, multinational corporations have been hoarding cash. Capital expenditures are at their lowest growth levels in six decades. Perhaps these large businesses have recognized that growth will be slow and that revenue growth will be a function of acquisitions.
Finally, new laws, regulation and taxation strangle small businesses — the recognized driver of economic growth for the past 60 years. The stranglehold that regulators have on community banks that restricted lending to small businesses is just one example.
Unfortunately, instead of recognizing that government policies have both slowed the economy and widened the income gap, politicians are likely to use these as wedge issues. So it appears that more regulations and increased taxation on small businesses and higher income earners is certain.
The Survival Mentality
In such a tough, low growth environment, businesses must be more innovative. For instance, 80 million Millennials (those between 15 and 35 years old) will soon have more spending power than any other generation in history. The common characteristic of this generation is they make spending decisions only after consulting social media (friends, Web sites, comments from strangers).
Businesses have to recognize this and play in that space. This generation also has different attitudes toward such things as cars. They are more interested in convenience and access than ownership. In addition, the recognition that the more highly educated are likely to have the disposable income may dictate marketing strategy.
In conclusion, don’t expect a return of the “if you build it, they will come” economy. Without an approach that is fundamentally different from what has been the norm for the past 30 years, many businesses will become extinct.
Robert Barone (Ph.D., economics, Georgetown University) is a principal of Universal Value Advisors, Reno, a registered investment adviser. Barone is a former director of the Federal Home Loan Bank of San Francisco and is currently a director of Allied Mineral Products, Columbus, Ohio, AAA Northern California, Nevada, Utah Auto Club, and the associated AAA Insurance Co., where he chairs the investment committee. Contact Robert Barone or the professionals at UVA (Joshua Barone and Andrea Knapp) are available to discuss client investment needs.
Call them at 775-284-7778.
Statistics and other information have been compiled from various sources. Universal Value Advisors believes the facts and information to be accurate and credible but makes no guarantee to the complete accuracy of this information.
Permalink
February 24, 2014
Posted in asset inflation, Banking, Big Banks, CPI, Federal Reserve, Inflation, investment advisor, investment banking, Markets, Nevada, Quantitative Easing, Real Estate, Robert Barone, Wall Street at 8:55 PM by Robert Barone
One of today’s economic myths is that the money that the Federal Reserve has created through its quantitative easing programs has not found its way into the money supply, and, as a result, no significant inflation has occurred.
The theory is that QE has only resulted in bank reserve creation, but little new money. Money and Banking 101 takes students through the “money multiplier” concept, where $1 of excess reserves can turn into $10 of new money if reserve requirements are 10%. Because there has been little net new bank lending since the Great Recession, the conclusion has been that there has been little money growth, and, therefore, minuscule inflation.
Those who tout this theory simply don’t understand how the money creation process works. In addition, inflation isn’t just measured by the narrowly defined and downwardly biased Consumer Price Index. Inflation means prices are rising, and, as I show below, we have plenty of that.
Money Creation
To show how the process actually works, assume that Citizen X buys $100,000 of securities from Citizen Y, and pays for it with a check drawn on X’s account at Bank XX. Citizen Y deposits the check in Bank YY. In this example, no new money has been created. An existing deposit at Bank XX was transferred to Bank YY.
Now assume that the Fed is the buyer of the $100,000 asset from Citizen Y. When Y deposits the check into his or her account at Bank YY, reserves in the banking system do rise by $100,000 as Bank YY ends up with a new deposit at the Fed.
But, also note that Citizen Y now has $100,000 in a deposit at Bank YY, a deposit that did not exist in the banking system prior to the transaction. Going back to Money and Banking 101, while the $100,000 may not be “multiplied” into $1,000,000 because the banks aren’t lending, the first step — the creation of $100,000 — did, indeed, occur.
The explosion in the assets on the Fed’s balance sheet of more than $3.3 trillion since the beginning of the QE process has resulted in the creation of at least that much new money. Using a back-of-the-envelope calculation, the change in currency in circulation as well as demand and savings deposits at commercial banks since the start of QE has been about $4.2 trillion. Net loan growth at those institutions has been about $1.1 trillion.The $3.1 trillion difference is, as expected, close to the growth of the Fed’s balance sheet.
Asset Inflation
So, why haven’t we had inflation if the money supply has grown so much? Well, we actually have had inflation. The only place we don’t find it is in the Bureau of Labor Statistics’ CPI calculation.
But, rather than dwelling on this single measure, consider that the form that inflation — rising prices — takes very much depends on what Citizen Y does with the newly created money, and what those who receive the money from Y do with it. More concretely, the Fed purchases from the large Wall Street institutions. So, it is likely that we will find inflation if we followed the path of the newly created money from those institutions.
As I have been discussing, about 25% of the newly created money over the past five years has gone into net new lending. Where did the rest of it go? It is a pretty sure bet that, given that these are Wall Street banks, much of it went into the equity and real estate markets. Equity prices as measured by the S&P 500 have risen by 150% over the five-year period, and by 29.6% in 2013 alone. Meanwhile, real estate prices as measured by the Case-Shiller 20-City Composite rose 13.7% last year.
It is also a pretty sure bet that the newly created money found its way into the emerging markets, where interest rates have been higher and the Fed’s promise of low U.S. rates for a long period of time (known as the “carry-trade”) significantly reduced the risk of the trade.
The latest 12-month official data show that inflation in Brazil is 5.6%, in India 8.8%, in Indonesia 8.2% and in Turkey 7.8%. Of course, we are all aware that the currencies of these countries have been crushed over the past six weeks, as hedge funds and other large investors have, en masse, withdrawn their funds as the prospect of a Fed tapering has become reality, along with expected rising rates.
Despite the so-called taper, the Fed continues to create a huge amount of money each month. Currently it’s $65 billion. This money has to find a home. It appears to be more than coincidental that, despite a 5.75% mini-correction in the equity market in January, prices have once again continued their upward trek.
Conclusion
More than $3 trillion of new money has been created by the Fed. It is sloshing around and causing prices to rise in equities, real estate and, until recently, in emerging markets. The money now coming out of the EMs will find another investment, causing those asset prices to rise.
We have inflation: asset inflation. The Fed continues to create money which finds its way into the financial markets. Is it any wonder why Wall Street loves QE and hangs on every word from the Fed? If history is any guide, asset inflation will continue as long as the Fed is printing. Just think what could happen to the money supply and inflation if the banks actually start to lend again.
And what might happen to asset prices if the Fed ever started to tighten?
Robert Barone (Ph.D., economics, Georgetown University) is a principal of Universal Value Advisors, Reno, a registered investment adviser. Barone is a former director of the Federal Home Loan Bank of San Francisco and is currently a director of Allied Mineral Products, Columbus, Ohio, AAA Northern California, Nevada, Utah Auto Club, and the associated AAA Insurance Co., where he chairs the investment committee. Contact Robert Barone or the professionals at UVA (Joshua Barone and Andrea Knapp) are available to discuss client investment needs. Call them at 775-284-7778.
Statistics and other information have been compiled from various sources. Universal Value Advisors believes the facts and information to be accurate and credible but makes no guarantee to the complete accuracy of this information.
Permalink
February 12, 2014
Posted in Banking, Capital, CBO, Congressional budget office, deflation, Economic Growth, Economy, emerging markets, establishment survey, Europe, Finance, GDP, Inflation, investment advisor, investment banking, investments, job market, labor force, Labor Market, obamacare, payroll tax reductions, Robert Barone, small business, Unemployment at 5:18 PM by Robert Barone
In countries where central banks are printing money, such as the US, UK, eurozone, and Japan, deflation is the fear. On the other hand, inflation is high in countries where central banks have followed more traditional policies, like Brazil (official inflation 5.9%), India (11.5%), Indonesia (8.4%), and Turkey (7.4%). One explanation is the carry trade. Because the central banks of the developed world promised low rates for the long term, the liquidity created by those central banks found its way into the economies of the emerging markets (EM) (read: borrow at low interest rates, invest at high ones). Unfortunately, most of those funds did not find their way into capital investment in those markets, but was instead used for consumption, which has played havoc with EM trade balances. When the demand side (usually measured by GDP) outstrips the supply side (potential GDP), inflation occurs. Now that the bubble in EM countries, caused by excess liquidity in the developed world, is starting to burst — investors no longer believe the carry trade will last much longer — what will become of all of that liquidity?
On February 4, the Congressional Budget Office (CBO), a supposed non-partisan government agency, released a shocking report, “The Budget and Economic Outlook: 2014 to 2024,” projecting that over the next 10 years the Affordable Care Act, commonly referred to as Obamacare, would reduce future employment rolls by more than 2.3 million. Overlooked in that report is the CBO’s projection that “potential” GDP in the US will be much slower over the next 10-year period than it has averaged since 1950; this in an age of innovation where rapid change is considered normal. The CBO says that “changes in people’s economic incentives caused by federal tax and spending policies set in current law are expected to reduce the number of hours worked…” and “that estimate largely reflects changes in labor hours worked owing to the ACA [Affordable Care Act].”
In the US, if the current gap between real GDP and potential GDP closes (and the so-called “slack” in the economy disappears as the CBO projects it will), then, just like in the EMs, any growth on the demand side of GDP above potential GDP, ends up, by definition, as inflation.
There are a many measures that indicate that the economy is much closer to its potential than is generally assumed. One such measure is the fact that, despite record levels of cash flow (used mainly for stock buybacks or dividends), for the past five years, corporations have not reinvested in their plant and equipment. According to David Rosenberg (Gluskin-Sheff), the average age of the capital stock in the US is almost 22 years, an average not seen since 1958. Given the fact that the cost of capital is near an all-time low, there is something holding back such investment. Rosenberg speculates that it is likely found in overregulation and the uncertainty regarding tax policy. An old and aging capital stock implies a much lower growth rate of potential GDP than in the past when the capital stock was younger.
The second issue is the labor force. While the December and January Establishment Survey disappointed the markets (December’s survey reported 75,000 jobs added; January saw a gain of 113,000), nobody is talking about the Household Survey. This is the survey from which the “official” unemployment rate is calculated. While more volatile that the Establishment Survey, the Household Survey showed gains of 143,000 jobs in December and a whopping 638,000 in January. When combined with other surveys (NFIB) which show that 23% of small businesses have at least one open position that they cannot fill (a six-year high according to Rosenberg), and that there is a sustained uptrend in voluntary quits, it would appear that the Establishment Survey is the outlier and that the labor market is quite tight.
If, indeed, the CBO is correct and potential GDP growth will slow over the next 10 years due to Obamacare, a tight labor market in conjunction with old capital stock will only exacerbate that situation. Since the financial crisis, the unemployment rate has fallen from 10.0% in October ’09 to 6.6% in January ’14, a 3.4 percentage point decline. During that period of time, the annual GDP growth rate has been about 2.4%. After the recession of the ’90s, to get the unemployment rate to fall 3.4 percentage points (from 7.8% to 4.4%), it took an annualized GDP growth rate of 3.7%. The lower GDP growth required to reduce the unemployment rate implies that the gap between actual and potential GDP is either small or nonexistent.
The aging of the capital stock, lack of new investment, and the tightening labor market indicate that resources are in short supply, which means that there is a strong probability that any semblance of robust economic growth will be accompanied by inflation. Adding to such pressure is the liquidity sloshing around the EM world. If it finds its way home, as appears to be happening, unless much of it goes into new capital formation (which is unlikely given the current regulatory and tax regimes), we are likely to see growing inflationary pressures much sooner than is currently priced into the financial markets.
Robert Barone (Ph.D., economics, Georgetown University) is a principal of Universal Value Advisors, Reno, a registered investment adviser. Barone is a former director of the Federal Home Loan Bank of San Francisco and is currently a director of Allied Mineral Products, Columbus, Ohio, AAA Northern California, Nevada, Utah Auto Club, and the associated AAA Insurance Co., where he chairs the investment committee. Contact Robert Barone or the professionals at UVA (Joshua Barone and Andrea Knapp) are available to discuss client investment needs.
Call them at 775-284-7778.
Statistics and other information have been compiled from various sources. Universal Value Advisors believes the facts and information to be accurate and credible but makes no guarantee to the complete accuracy of this information.
Permalink
February 4, 2014
Posted in business, Business Friendly, Dodd Frank, Economic Growth, Economy, Federal Reserve, Finance, income gap, Inflation, lending, Public Policy, Quantitative Easing, small business at 9:12 PM by Robert Barone
There is no doubt that the gap between the rich and the middle class and poor has widened in recent years. And the most recent studies confirm a continuation of that trend with capital gains playing a major role.
What is ironic is that public policies — some long practiced, some new, — contribute significantly to the problem. Recognizing and fixing such policy issues, however, is easier said than done.
In this post, I will discuss three such policies: 1) The asset inflation policies of the Fed; 2) The policy that significantly understates inflation; and 3) The policies that strangle lending to small business. There are many other public policies, such as work disincentives, that also have an impact, but I’ll discuss them another time
Fed Policy
Since the financial crisis, the Fed, through its “quantitative-easing” policies, has relied upon the “wealth effect” via equity asset price inflation to combat the so-called deflationary forces that had built up in the economy.
Each time a QE policy ended, there was a big decline in equity prices. Those declines prompted another round of QE.
As indicated above, capital gains have played a major role in the recent growth of the income gap. Those gains also played a major role in the dot.com and subprime bubbles of the recent past.
Inflation
In his Jan. 29 missive to clients, David Rosenberg of Gluskin Sheff, a wealth-management firm, said that “if we were to replace the imputed rent measure of CPI (consumer price index) with the actual transaction price measure of the CS-20 [Case Shiller home price index], core inflation would be 5.3% today, not 1.7% as per the ‘official’ government number…”
John Williams (www.shadowstats.com) indicates that, using the 1990 CPI computation, inflation in the U.S. was 4.9% in 2013; using the 1980 computation method, it was 9.1%.
Those of you old enough may remember that in 1980 the then new Fed Chairman, Paul Volker, began to raise interest rates to double-digit levels to combat an inflation that was not much higher than the 9.1% of today (if the 1980 methodology is used).
Over the years the Bureau of Labor Statistics has changed the computation method for CPI, in effect, significantly biasing it to produce a much lower inflation rate.
In a post I wrote last September (“Hidden Inflation Slows Growth, Holds Down Wages,” TheStreet.com, 9/13/13), I showed how the growth of wages earned by middle-class employees has hugged the “official” inflation trend.
If that “official” inflation trend understates real inflation by 3% per year (the difference between Williams’ computation using the 1990 methodology and 2013’s “official” rate is 3.1%), over a 20-year period, the real purchasing power of that wage would fall by more than 80%.
That helps to explain why both husbands and wives must work today, why the birth rate is falling and why the income gap is widening.
Once again, changing the inflation measurement problem is easier said than done. In the U.S., Japan, the U.K and the eurozone, debt levels are a huge issue. Lower inflation rates keep interest rates low, allow new borrowing (budget deficits) at low rates and keep the interest cost of the debt manageable (at least temporarily).
Also, a low official rate keeps the cost-of-living adjustments for social programs — Social Security, Medicare and government pensions — low. As a result, Social Security, Medicare and pension payments are significantly lower than they otherwise would be. Returning to the older, more accurate inflation measures would truly be budget busting.
Constraints on Small Business Lending
One of the reasons that the economic recovery has been so sluggish is the inability for small business to expand. Since the financial crisis, much of the money creation by the Fed has ended up as excess reserves in the banking system (now more than $2.3 trillion).
Small businesses employ more than 75% of the workforce. So, why aren’t banks lending to small businesses?
In prior periods of economic growth, especially in the 1990s and the first few years of the current century, it was the small and intermediate-sized banks that made loans to small businesses in their communities.
Today, for many of the banks that survived the last five years, there are so many newly imposed reporting and lending constraints (Dodd-Frank) and such a fear of regulatory criticism, fines or other disciplinary action that these institutions won’t take any risk at all. In earlier times, the annual number of new community bank charters was always in the high double digits.
But, since 2011, the FDIC has approved only one new bank charter that wasn’t for the purpose of saving an existing troubled bank. Only one!
In effect, the federal regulators now run the community banking system from seats of power in their far away offices.
Small businesses cannot grow due to the unavailability of funding caused by overregulation and government imposed constraints. This holds down the income growth of much of the entrepreneurial class and is a significant contributor to income inequality. Of the policies discussed in this post, this would be the easiest to change.
Conclusion
There is definitely a growing income gap, but, much of it is the result of public policy. New elections or new legislation won’t fix these policies. The first step is recognition. But, as I’ve pointed out, many of these policies are rooted in the fabric of government.
There is little desire on the part of those comfortably in power to recognize them, much less to initiate any changes.
Robert Barone (Ph.D., economics, Georgetown University) is a principal of Universal Value Advisors, Reno, a registered investment adviser. Barone is a former director of the Federal Home Loan Bank of San Francisco and is currently a director of Allied Mineral Products, Columbus, Ohio, AAA Northern California, Nevada, Utah Auto Club, and the associated AAA Insurance Co., where he chairs the investment committee. Contact Robert Barone or the professionals at UVA (Joshua Barone and Andrea Knapp)
are available to discuss client investment needs. Call them at 775-284-7778.
Statistics and other information have been compiled from various sources. Universal Value Advisors believes the facts and information to be accurate and credible but makes no guarantee to the complete accuracy of this information.
Permalink
January 27, 2014
Posted in Ben Bernanke, Big Banks, Economy, Europe, Foreign, gold, investment advisor, investment banking, investments at 11:02 PM by Robert Barone
|
Until inflation becomes recognized, the investor holding gold as a hedge must have both patience and the ability to hold for an extended period.
|
Historically, the price of gold protected the purchasing power of the currency invested in it, as the price rose in some reasonable correlation with existing or expected inflation of that currency. But today, the price of gold is set in a speculative market where traders and hedge fund managers make bets, and little or no attention is paid to gold’s traditional role. (See the first part of this article, Why Gold Prices Dropped in 2013.) According to John Hathaway of Tocqueville.com, in 2010, the physical gold market consisted of 121 million ounces. With a growth rate of about 1.5% per year, there are currently about 127 million ounces in existence, as of Hathaway’s writing. Using futures and options data, and OTC clearing data from the London Bullion Market Association, Hathaway calculates that the paper gold market is 92 times that of the underlying physical market. If each investor in a paper gold ounce believes it is backed by an ounce of physical gold, then each physical gold ounce must have been loaned or hypothecated, on average, 92 times. If everyone decided that they wanted physical possession, which of the 92 paper gold ounce owners really owns the physical metal?
That, of course, explains why it took so long (17 months) for the London banks to deliver the physical gold that Hugo Chavez’s Venezuela demanded. They either didn’t have it and had to purchase it in the open market, or they had to unwind trades where the gold was loaned or pledged as collateral, or both. As for the seven years that it will take for the US Fed to deliver Germany its gold, the only conclusion can be that the web of hypothecation must be long and complex.
Let’s now consider the characteristics of the London financial markets, where gold’s price is fixed twice each day. Nearly every well-known financial calamity over the past 20 years has originated from London offices of major financial corporations. That’s because in the UK, financial institutions have little regulatory oversight. Just think about JPMorgan’s (NYSE:JPM) $6+ billion 2012 loss from its London trading office. We learned from the MF Global (OTCMKTS:MFGLQ) fiasco that client assets can be hypothecated and re-hypothecated an infinite number of times, and that there are no customer protection rules. If you have been wondering what happened to Jon Corzine’s (MF Global’s CEO) clients’ funds, you now have a pretty good idea.
Recently, we’ve seen major UK financial institutions pay hefty fines for manipulating certain commodity prices and for fixing the price of LIBOR, a short-term rate that plays a key role in the world’s financial markets. Apparently, the illegal activity had been going on for years. There are five London banks that control the two daily London gold price fixes. Given the known shenanigans of the London banks regarding LIBOR and other commodities, and the infinite re-hypothecation allowed, how much confidence should we have that the daily gold price-fixing is impartial, that in a crisis or panic the hypothecations can be unwound with every paper claim on gold made whole, or, in fact, that some of the underlying gold even exists in the vaults? As Hathaway says, “It would be hard to imagine that the culture of [London] did not extend to gold.”
There has been a great deal of political angst by Bernanke and Co. over the demand by some members of Congress for a Fed audit, and great political maneuvering to avoid it. Some commentators, like John Williams (Shadowstats.com), believe that the Fed and government officials disdain rising gold prices because that suggests that the government and the Fed are not doing their jobs in maintaining price stability. Hence, Williams believes that heavy selling in 2013 was an orchestrated government intervention. In his January 8, 2014 issue of Hyperinflation 2014 – The End Game Begins, Williams says, “A number of times, very large sell-orders from one customer were placed in the global markets before the open of US trading. For someone looking to move out of gold, orderly sales would make the most sense in terms of getting the best prices. Instead, these actions were designed to pummel the gold markets, and they did.”
Remember what happened to credit default swaps, issued by AIG (NYSE:AIG), just five years ago? Remember what happened to AAA-rated mortgage-backed securities that turned out to have a lot of sub-prime loans? Could something like that happen to the paper gold market?
If it’s discovered that some of the underlying gold has disappeared from the vaults, or in a panic the competing hypothecations for the underlying gold ounces tie up the assets in a long-term court battle, or, as in the case of General Motor’s (NYSE:GM) senior secured bondholders and some depositors in Cypriot banks, it becomes politically correct to single out a class to bear losses, some holders of paper gold could be out of luck. It might be very painful one day to wake up to find that the paper gold investment you thought you had turns out to have not been collateralized.
So, what should gold investors do?
First, understand the difference between hedging and speculating. If it is your intent to hedge against an inflation that you believe will inevitably come due to current worldwide monetary- and fiscal-policy excesses, then the systematic purchase of gold, like mutual fund dollar-cost averaging, is a good practice.
In what form should you hold your precious metal assets? What about the ETFs traded on the exchanges? If you want to keep the gold in your brokerage account, there are some funds or ETFs that say that they hold bullion in a vault and do not hypothecate it. You need to do careful research to make sure this is the case and know if the paper you hold is convertible into the underlying asset. Gold mining stocks are another way, since the gold is there in the ground. Unfortunately, the typical gold mining company continuously dilutes shareholders with new rounds of equity offerings as they continue their search for the “mother lode.” So, research here is also essential.
The safest way, of course, is to hold the gold yourself, i.e., take physical possession and put it into a safety deposit box or in your own safe. Many Americans are doing this, but the Chinese and Asians are way out ahead in this area. To do this you need to find a reputable gold or coin shop that will sell to you for a reasonable commission, say 3-4%.
Today’s gold investors must also understand that the price of gold is currently a 100% function of hedge fund speculation. In the future, as inflation becomes recognized, this may change, but until it does, the investor holding gold as a hedge must have both patience and the ability to hold for an extended period — oh yes, and the ironclad belief that the laws of economics haven’t changed, i.e., that “this time is different” is a lot of bunk.
Robert Barone (Ph.D., economics, Georgetown University) is a principal of Universal Value Advisors, Reno, a registered investment adviser. Barone is a former director of the Federal Home Loan Bank of San Francisco and is currently a director of Allied Mineral Products, Columbus, Ohio, AAA Northern California, Nevada, Utah Auto Club, and the associated AAA Insurance Co., where he chairs the investment committee. Barone or the professionals at UVA (Joshua Barone, Andrea Knapp, and Marvin Grulli) are available to discuss client investment needs.
Call them at 775-284-7778.
Statistics and other information have been compiled from various sources. Universal Value Advisors believes the facts and information to be accurate and credible but makes no guarantee to the complete accuracy of this information.
Permalink
January 14, 2014
Posted in Banking, Big Banks, Economic Growth, Economy, Europe, Federal Reserve, Finance, Foreign, gold, Inflation, interest rates, investment advisor, investments, Robert Barone at 6:39 PM by Robert Barone
Most seasoned investors have some allocation to precious metals in their portfolios, most often gold. They believe that such an allocation protects them, as it is a hedge, or an insurance policy, against the proliferation of paper (fiat) money by the world’s largest central banks. Fiat money is not backed by real physical assets. In concept, I agree with this sentiment. Most investors who invest in precious metals ETFs, such as the SPDR Gold Trust ETF (NYSEARCA:GLD), through the supposedly regulated stock exchanges (“paper gold”) believe that they actually have a hedge against future inflation. In what follows, I will try to explain why they may not, and why their investments in paper gold may just be speculation.
On February 5, 1981, then Fed Chairman Paul Volcker said that the Fed had made a “commitment to a monetary policy consistent with reducing inflation…” Contrast that with the statement of outgoing Fed Chairman Bernanke on December 18, 2013: “We are very committed to making sure that inflation does not stay too low…”
During 2013, the price of gold fell more than 28% (from $165.17/oz. to $118.36/oz.) despite the fact that other assets like real estate and equities each rose at double-digit rates. It is perplexing that the price of the hedge against inflation is falling in the face of a money-printing orgy at all of the world’s major central banks. Despite the fact that these central banks have fought the inflation scourge for half of a century, suddenly they have all adopted policies that espouse inflation as something desirable. The fall in the price of gold is even more perplexing because there are reports of record demand for physical gold, especially in Asia, and that some of the mints can’t keep up with the demand for standardized product. In his year-end missive, John Hathaway of Tocqueville.com says that “the manager of one of the largest Swiss refiners stated that after almost doubling capacity this year, ‘they put on three shifts, they’re working 24 hours a day…and every time [we] think it’s going to slow down, [we] get more orders…70% of the kilo bar fabrication is going to China.'”
One would also think that the price of gold should be rising because of a growing loss of confidence in fiat currencies. Here are some indicators:
The growing interest in Bitcoin as an alternative to government-issued currencies. One should ask, why did the price of Bitcoin rise from $13.51 on December 31, 2012 to $754.76 on December 30, 2013 while the price of gold fell? As you will see later in this essay, the answer lies in leverage. The gold market is leveraged; Bitcoin is not (at least, not yet).
The volatility that the Fed has caused in emerging market economies by flooding the world with dollars at zero interest is another reason the price of gold should be rising. The Fed’s announced zero-rate policy with a time horizon caused huge capital flows into emerging market economies by hedge funds looking for yield. The inflows caused disruption to the immature financial systems in those emerging markets. And then, with the utterance of a single word, “tapering,” all of the hedge funds headed for the exits at once. The Indian rupee, for example, which was trading around 53 rupees/dollar in May 2013, fell to 69 near the end of August, a 30% loss of value. Such behavior has stirred up new interest on the part of major international players (China, Russia) to have an alternative to the dollar as the world’s reserve currency. Don’t dismiss this as political posturing. It is based on irresponsible Fed policy in its role as the caretaker of the world’s reserve currency. As the world moves toward an alternative reserve currency, the dollar will weaken significantly relative to other currencies, and, theoretically, to gold (and even Bitcoin).
The loss of confidence on the part of some sovereign nations that the gold they have stored in foreign bank vaults is safe. Two examples immediately come to mind: Venezuela and Germany. In August of 2011, the President of Venezuela, Hugo Chavez, demanded that the London bullion banks that were holding Venezuela’s gold ship it to Caracas. (Again, don’t dismiss this as political posturing.) Despite the fact that the shipment could have been carried on a single cargo plane, it took until late January 2012 (17 months), for the London banks to completely comply. One should wonder why. Then, the German Bundesbank asked for an audit of its gold holdings at the Fed. One knows how the Fed has resisted audits from Congress, so why should a request from a German bank meet with any different result? After political escalation, a German minister was permitted to see a room full of gold at the New York Fed. In early 2013, the Bundesbank publicly announced that its intent was to repatriate its gold from the vaults in Paris, London, and New York. We have now learned that it will take seven years for the New York Fed to ship the gold earmarked as belonging to Germany in the Fed’s vaults. One should wonder why such a long delay.
In the face of all of this — unparalleled money printing, the rise in the prices of real estate and equities in 2013, and the creeping suspicions regarding the real value of fiat currencies — how is it that the price of gold fell 28% in 2013? The answer lies in leverage and hypothecation, the modus operandi of Wall Street, London, and financiers worldwide. The paper gold market, the one that trades the ETFs such as the SPDR Gold Trust, is 92 times bigger than the physical supply of gold according to Tocqueville’s John Hathaway. Think about that. It means that each physical ounce of gold that actually exists has been loaned, pledged, and re-loaned 92 times on average. Each holder in the paper gold market thinks that the ounce of paper gold held in the brokerage account is backed by an ounce of real gold. But there are, on average, 92 others who apparently have a claim on the same real, physical ounce.
The answer to the question, why did gold fall 28% in 2013 when, theoretically, it should have risen, is that Wall Street, London, and hedge funds have turned the paper gold market into a market of speculation, where the price rises or falls, not based on the purchasing power of currencies (the hedging characteristic of gold), but on such things as whether or not the Fed will taper, what impact Iranian nuclear talks will have on oil flows, if the interest rates in the eurozone periphery are likely to rise or fall, etc.
In my next article, I will explain how all of this occurred, and what investors who want to hedge and not speculate should do.
Robert Barone (Ph.D., economics, Georgetown University) is a principal of Universal Value Advisors, Reno, a registered investment adviser. Barone is a former director of the Federal Home Loan Bank of San Francisco and is currently a director of Allied Mineral Products, Columbus, Ohio, AAA Northern California, Nevada, Utah Auto Club, and the associated AAA Insurance Co., where he chairs the investment committee. Barone or the professionals at UVA (Joshua Barone, Andrea Knapp and Marvin Grulli) are available to discuss client investment needs.
Call them at 775-284-7778.
Statistics and other information have been compiled from various sources. Universal Value Advisors believes the facts and information to be accurate and credible but makes no guarantee to the complete accuracy of this information.
Permalink
December 30, 2013
Posted in Auto Industry, business, Economic Growth, Economy, Finance, GDP, gold, government, Housing Market, Inflation, interest rates, investment advisor, investment banking, Labor Market, Manufacturing, Robert Barone, Unemployment, Wall Street at 8:45 PM by Robert Barone
The holiday season is the traditional time of year to prognosticate about the upcoming year. But, before I start, I want to make a distinction between short-term and long-term forecasts.
Long-term trends are just that, and they unfold slowly. And, while I have great concerns about the long-term consequences of inflation, the dollar’s role as the world’s reserve currency, the bloated Fed balance sheet and resulting excess bank reserves, and the freight train of unfunded liabilities which will impact the debt and deficit, because these are long-term issues and simply don’t appear overnight, I do not believe there is anything contradictory about being optimistic about the short-term.
With that caveat, here are my predictions for 2014:
1. Real GDP will grow faster in 2014 (3.5%): The “fiscal drag” that caused headwinds for the economy has now passed with the signing of the first budget in four years in mid-December. Since 2009, governments at all levels have been shedding jobs. But, that has now all changed. The November jobs reports show that employment at all levels of government has turned positive.
No matter your view of the desirability of this for the long-term, in the short-term, those employees receive paychecks and consume goods and services. I predict the real gross domestic product growth rate will be more than 3.5 percent in 2014.
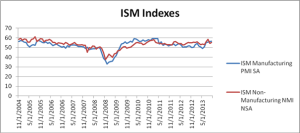
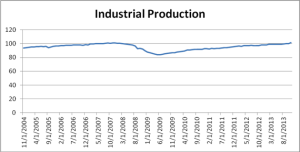
2. Manufacturing and trade are healthy and will get better in 2014: The Institute for Supply Management’s indexes, both manufacturing and non-manufacturing, are as high or higher than they were in the ’05-’06 boom. In November, industrial production finally exceeded its ’07 prior peak level.
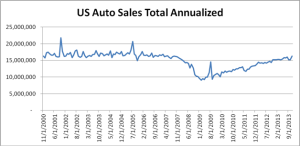
Auto sales today are as frothy as they were in the pre-recession boom, and auto sales in the holiday buying period are destined to surprise to the upside. Online sales in the weekend before Christmas overwhelmed both UPS and FedEx, causing many gifts to be delivered on the 26th.
3. Housing, while not near its old bubble peak, has turned the corner: Part of the reason the economy is not overheating is housing. While November’s housing starts surprised to the upside, they still only represent 53 percent of their bubble peak. Nevertheless, because new home construction has been in the doldrums for the past six years, the resurgence evident in the economy has pushed the median price of homes to the point where many homeowners, who were underwater just a couple of years ago, can now show positive home equity on their balance sheets
While interest rates have risen and may be a cause for concern for housing, they are still very low by historic standards, and we have a Fed that, on Dec. 18, recommitted to keeping them down for a period much longer than the market ever anticipated.
4. The unemployment rate will end 2014 somewhere near 6%: Because the popular unemployment index is a lot higher today than it was in the ’05-’06 boom (7 percent vs. 5 percent), the popular media assumes that the labor markets are still loose. But, demographics and incentives to work have changed over the past seven years.
The labor sub-indicators imply much tighter labor conditions than the traditional unemployment index would lead one to believe. Recent data for nonfarm payrolls are equivalent to their monthly numbers in ’05-’06. Weekly new jobless claims are in a steep downtrend. The sub-indexes for layoffs and discharges are lower than they were in ’05-’06. And hard-to-fill-position and job-opening subindexes are in definite uptrends and are approaching ’05-’06 levels. As a result, expect a steady decline in the unemployment rate in 2014.
5. Investment in new plant & equipment will rise in 2014: For the past 5 years, large-cap corporations have hoarded cash and have not reinvested in their businesses. As a result, because equipment and technology is older, labor productivity has stagnated. This is one reason for the strong labor market. In 2014, I predict there will be an upturn in the reinvestment cycle. Beneficiaries will be technology companies and banks.
6. Inflation will be higher in 2014, both “officially” and in reality: While every individual player in the financial markets knows that everyday prices are rising, each espouses the Fed’s deflation theme, perhaps only to play along hoping the Fed will continue printing money.
Are we to believe that the jump of retail sales in October of 0.6 percent followed by 0.7 percent in November were all without price increases as the Bureau of Labor Statistics says? The “official” consumer price index says that airline fares have not increased despite the 18 percent growth of airline revenues in 2013 (bag check fees, etc.)? Should we believe that double-digit revenue growth rates at restaurants are volume-only and we are just eating more? I don’t know what the actual rate of inflation is, but it sure feels like it is higher than 5 percent. In 2014, it will be even higher than that.
7. Equity markets will rise in 2014: The fiscal headwinds are behind us; industrial production and sales are strong; housing is healing, the rise in home prices have generally raised consumer confidence; there appears to be the beginning of an upturn in the capital investment cycle; and, most important, the labor markets are strong. Any equity market corrections should be bought. Meanwhile, longer-duration bonds should be avoided unless there is an accompanying hedge instrument.
8. Gold — it should rise in 2014, but this is a tricky market: Every indicator points to a rise in the price of gold, especially since all of the world’s major central banks are printing money at record rates. But, contrary to logic, the price of gold has fallen in 2013 by nearly 30 percent.
The reason behind this lies with leverage and hypothecation — getting a loan using collateral — in the gold market. Once again, Wall Street has discovered that money could be made by leveraging; and the paper gold market is about 100 times larger than the physical market. When you have that kind of leverage, collusion, price fixing, or just plain panic can quickly move markets.
As inflation is recognized, the price of gold (both physical and paper) should rise. In a healthy economic year, as I predict for 2014, a collapse in the paper gold market is unlikely, and perhaps the price of gold will rise in response to rapidly expanding fiat money. But beware. The only safe gold is what you can hold in your hand.
Permalink
December 27, 2013
Posted in business, debt, Economic Growth, Economy, Europe, Finance, Foreign, Inflation, investment advisor, investment banking, investments, Markets, National Deblt, Robert Barone at 4:46 PM by Robert Barone
If you’ve read Part I of this year end outlook, you know that it is our view that the underlying private sector is healthy and, except for the fact that the real rate of inflation is much faster than the ‘official’ rate, we could well have a short period of prosperity.
Unfortunately, our long-term outlook is not as sanguine as our short-term view. The eventual recognition of the inflation issue, the dollar’s role as the world’s reserve currency, the bloated Fed balance sheet and the resulting excess bank reserves, and the freight train of unfunded liabilities and its impact on the debt and deficit are issues that have large negative long-term consequences. Remember, the long-term unfolds slowly, and we don’t expect that we will wake up one day to find that all has changed. Still, the changes discussed below could very well take place over the next decade, and investors need to be prepared.
The Dollar as the Reserve Currency
The dollar is currently the world’s reserve currency. Most world trade takes place in dollars, even if no American entity is involved. Because world trade has rapidly expanded over the past 20 years, more dollars have been needed than those required for the U.S. economy alone. As a result, the U.S. has been able to run large deficits without any apparent significant impact on the dollar’s value relative to other major currencies. Any other country that runs a large deficit relative to their GDP suffers significant currency devaluation. Current policy in Japan is a prime example. A weakening dollar has implications for the prices of hard assets.
In addition, the Fed’s policy of Quantitative Easing (essentially money printing) has disrupted emerging market economies. Zero rates and money creation caused hedge fund managers to leverage at low rates and move large volumes of money offshore to emerging nations where interest rates were higher. The initial fear of “taper” in May and June caused huge and sudden capital outflows from those countries resulting in massive economic dislocation in those markets. In India, for example, the Rupee was pummeled as the hedge fund investors, fearing that interest rates were about to suddenly rise, all tried to unwind their Rupee investments at the same time. And now that ‘taper’ has officially started and longer-term rates are expected to rise, these issues will continue. Those countries have all taken defensive measures. India, for example, imposed taxes on gold imports, which has impacted the gold markets but has reduced India’s balance of payments deficit.
As a result of such tone deafness on the part of the Fed, and because there now appears to be enough dollars in the world for the current level of trade, the international appetite for U.S. dollars is clearly on the wane. Japan and China, the two largest holders of Treasury debt, have recently reduced purchases. Most emerging market nations and large players like Russia and China have vocally called for an alternative to the dollar as the world’s reserve currency. This movement is alive and well.
The Fed’s Balance Sheet
As the economy expands, the size of the Fed’s balance sheet and the level of excess bank reserves will become a problem. There are $2.3 trillion of bank reserves in excess of what are ‘required’ under the law and regulations. (Required reserves for the U.S. banking system are $.067 trillion; so, the system has 34x more reserves than it needs.) Under ‘normal’ conditions, and the way the system was designed to work, if the economy got too hot, the Fed could sell a small amount of securities out of its portfolio which would reduce bank reserves to the point where banks would have to ‘borrow’ from the Fed. Because bankers are hesitant to do that, and because the Fed could raise the ‘discount’ rate, the rate charged for the borrowings, the Fed could control new lending and thus the economic expansion. This isn’t possible today as the Fed would have to sell $2.2 trillion to cause banks to have to borrow. Such a volume of sales would likely cause a crisis in the financial system, or even collapse. Today, the only way the Fed has to stop the banks from lending is to pay them not to lend – this is exactly the opposite of the intent of the original legislation and the opposite of how the Fed has worked for most of its 100 year history.
Furthermore, given the growing lack of confidence in the dollar as the world’s reserve currency, if fiscal budget deficits grow in the future, the Fed may end up as the major lender (i.e., lender of last resort) for the U.S. Treasury. That simply means more money creation.
Unfunded Liabilities-
The U.S. Treasury officially recognizes $85 trillion as the amount of unfunded liabilities of the Federal Government. Other professionals set this number near $120 trillion. For comparison, the annual U.S. GDP is about $16 trillion. The budget deficit reported in the media is a cash flow deficit (tax collections minus expenditures). The budget deficit doesn’t include promises made for future payments (Medicare, Medicaid, Social Security, government pensions) which have been running between $4 and $5 trillion annually for the past few years. These amounts simply get added to the ‘unfunded’ liability number.
As the population ages, these payments will have to be made, and the budget may become overwhelmed. (You see the relevance of the remark made above about the Fed being the lender of last resort for the Treasury.) This is the heart of the debate about ‘entitlements’ that has been front and center for the past decade.
Solutions (none of which you will like)
Philipp Bagus is a fellow at the Ludwig von Mises Institute in Europe. He is well known in Europe for his work on financial issues there. In a recent paper, Bagus says that there are several possible ways out of the current money printing predicament. Any one or a combination is possible. We have put them in an order of most likely to least likely to be used:
- Inflation – this is the natural outcome of printing money;
- Financial Repression – this is current Fed policy; savers and retirees bear a disproportionately large burden as inflation eats at their principle but there is no safe way to earn a positive real rate of return;
- Pay Off Debt – this means much higher levels of taxation, and is definitely a real possibility. In Europe, the International Monetary Fund (IMF) has proposed a one-time 10% wealth tax. As the unfunded liabilities push up the federal deficit, expect such proposals in the U.S.;
- Bail-In – In ’08-’09 we saw ‘bail-outs’ where the government saved GM, Chrysler, AIG and the Too Big to Fail banks by buying stock or otherwise recapitalizing them. A ‘bail-in’ refers to the financial system. Banks and other depositories have liabilities called deposits. The depositors do not consider themselves ‘lenders.’ But, in a ‘bail-in,’ it is the depositors who lose. Their deposits are ‘converted’ to equity in the bank. When they try to sell their bank shares, they find that it will fetch only a fraction of the value of their deposits. A variant of this is what happened in Cyprus in the spring of 2013. Because of the distaste the public now has for ‘bail-outs,’ if there is another financial crisis, this is likely to be the method used;
- Default on Entitlements – when we talk about ‘entitlement reform’ in the U.S., we really mean at least a partial default. It is likely that some people simply won’t get what they were promised. We put this low on the list because we have witnessed a political process that won’t deal with the issue;
- Repudiate Debt – Because the government can simply print money to pay it debts, this is the least likely of all of the possibilities in the U.S.
The long-term issues are serious. And not addressing them simply means a higher level of pain when addressing them is required. Remember, these are long-term issues. They are all not likely to occur at the same time, nor will they simply appear overnight. The first signs of trouble will occur when markets begin to recognize that the ‘official’ inflation rate significantly understates reality, or that the inflation data become so overwhelming that they can no longer be masked. Even then, markets may come to tolerate higher inflation, as after 100 years of fighting inflation, the Fed and the world’s major central banks have embraced it as a good thing.
Meanwhile, as set forth in Part I of this paper, the immediate outlook for the economy is upbeat. Enjoy it while it lasts.
December 20, 2013
Robert Barone, Ph.D.
Joshua Barone
Andrea Knapp Nolan
Dustin Goldade
Robert Barone (Ph.D., economics, Georgetown University) is a principal of Universal Value Advisors, Reno, a registered investment adviser. Barone is a former director of the Federal Home Loan Bank of San Francisco and is currently a director of Allied Mineral Products, Columbus, Ohio, AAA Northern California, Nevada, Utah Auto Club, and the associated AAA Insurance Co., where he chairs the investment committee. Barone or the professionals at UVA (Joshua Barone, Andrea Knapp and Marvin Grulli) are available to discuss client investment needs.
Call them at 775-284-7778.
Statistics and other information have been compiled from various sources. Universal Value Advisors believes the facts and information to be accurate and credible but makes no guarantee to the complete accuracy of this information.
Permalink
Posted in Banking, business, Economic Growth, Economy, Federal Reserve, Finance, Housing Market, investment advisor, investment banking, investments, Markets, mortgage rates, Robert Barone at 4:41 PM by Robert Barone
Those who read our blogs know that over the past 6 months or so, we have turned positive on the underlying private sector of the U.S. economy. We have had comments from several readers about this apparent change of heart, some of them almost in disbelief. So, let us dispel any doubts. There is a huge difference between the short-term and the long-term outlooks. Let’s realize that long-term trends are just that, long-term, and that they take a long time to play out. As you will see if you read through both parts of this year end outlook, our long-term views haven’t changed. But, since the long-term doesn’t just suddenly appear, there really isn’t anything contradictory in being optimistic about the short-term. As a result, we have divided this outlook up into its two logical parts, the short-term and the long-term.
Let’s start with the short-term. First, at least through 2014 and probably 2015, the ‘fiscal drag’ that caused headwinds for the economy has now passed with the signing of the budget deal in mid-December. In his December 18th press conference, Fed Chairman Bernanke indicated that four years after the trough of the ’01 recession, employees at all levels of government had grown by 400,000; but at the same point today, that number is -600,000, i.e., a difference of a million jobs. Think of that when you think about ‘fiscal drag.’ The November jobs data shows that jobs at all levels of government have now turned positive. No matter your view of the desirability of this, those employees receive paychecks and can consume goods and services. So, from a short-term point of view, the ‘fiscal drag’ has ended, and, all other things being equal, this will actually spur the growth rate of real GDP.
Manufacturing and Trade
The institute for Supply Management’s (ISM) indexes, both manufacturing and non-manufacturing, are as high or higher than they were in the ’05-’06 boom period. This is shown in the chart immediately below.
Shown in the next chart is industrial production, which in November, finally exceeded its ’07 peak.
Now look below at the auto chart. Sales are as frothy today as they were in the pre-recession boom. Sales for the holiday buying period are destined to surprise to the upside.
Housing
Part of the reason that the economy is not overheating is housing. The chart clearly shows that housing starts are significantly lagging their ’05-’06 levels. But, recognize that ’05-’06 was the height of the housing bubble.
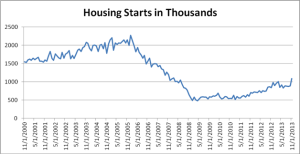
November’s housing starts surprised to the upside. But, they are still only 53% of their bubble peak. Nevertheless, because new home construction has been in the doldrums for the past six years, the resurgence evident in the economy has pushed the median price of a new home north of what it was then. In addition, the lack of construction has put the months’ supply of new homes at less than 3. In the housing bubble, when everyone was in the market, the average level of supply was 4 months. So, in some respects, the current housing market is hotter than it was at the height of the bubble. And, while interest rates have risen and are a cause for concern, they are still very low by historic standards, and we have a Fed that on December 18th recommitted to keeping them down for a period much longer than the market had anticipated.
Labor Markets
Because the popular unemployment index is a lot higher today than it was in the ’05-’06 boom (7% vs. 5%), the popular media assumes that the labor markets are still loose. But, demographics and incentives to work have changed over the past seven years. The labor sub-indicators imply a much tighter labor market than the traditional unemployment index would lead one to believe. Recent new nonfarm payrolls are equivalent to their monthly gains of ’05-’06. The weekly Initial Jobless Claims number for the week ending 11/30 was 298,000. Except for one week this past September, you have to go all the way back to May ’07 to find a number that low. The first chart below shows the definite downtrend in new and continuing jobless claims.
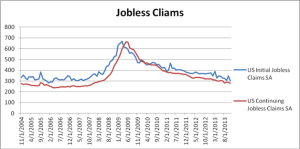
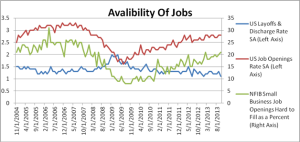
The next chart shows that layoffs and discharges are lower than they were in ’05-’06 and that both the “Job Openings” and “Jobs Hard to Fill” sub-indexes are in up trends and are approaching ’05-’06 levels.
The Aggregates
So, while auto sales are booming, the labor markets are tight, and manufacturing and services are expanding at or near boom levels, why do the aggregates (Real GDP, for example) appear so depressed? One explanation that we think has some credibility, is that there has been an expansion in the underground economy (barter; working for cash, etc.). The ‘fiscal drag’ headwinds discussed earlier, have, no doubt, had a large impact on the sluggish growth in the aggregates. On a positive note, the latest revisions to Q3 ’13 Real GDP show a growth rate of 4.1%, which, on its face, supports our short-term optimism. And until mid-December, the markets had discounted this as resulting mainly from growth in unwanted inventories. But Black Friday and Cyber Monday sales along with upbeat ongoing retail reports tell us something different, i.e., the inventory growth was not unwanted at all. While the markets expect a 2% Real GDP growth for Q4 ’13, don’t be surprised if it is much higher.
Short-term Implications
The underlying data, at least for the next 6 to 12 months, point to a strengthening economy. Certainly, a stock market correction is possible. We haven’t had one for more than 2 years. But, while possible, a significant downdraft like those of ’01 or ’09, don’t typically occur when the economy is accelerating (1987 is an exception) without an extraneous and unanticipated shock. With the signing of the first budget deal in four years, and with the Fed clearing the air about tapering and actually extending its announced period of zero interest rates, almost all of the short-term worries appear to be behind us, except one.
Inflation – The Potential Fly in the Ointment
The ‘official’ Consumer Price index (CPI) was flat in November, dominated, as it has been all autumn, by the fall back in gasoline prices. Somehow, while we all know that everyday prices are rising at a significant pace, the markets have bought into the deflation theme. Perhaps the belief is that if the markets play along with the Fed’s low inflation theme, the Fed will remain easier for longer.
In his December 16th blog, David Rosenberg (Gluskin-Sheff) has the following to say about inflation:
I have a tough time reconciling the ‘official’ inflation data with what’s happening in the real world… the .7% jump in retail sales in November on top of +.6% in October – these gains were all in volume terms? No price increases at all? Restaurants are now registering sales at a double-digit annual rate… No price increases here? The BLS tells us in the CPI data that there is no pricing power in the airline industry and yet the sector is the best performing YTD within the equity markets… global airline service fees have soared 18% in 2013… these [fees] are becoming an ever-greater share of the revenue pie and one must wonder if they are getting adequately captured in the CPI data.
Inflation could be the fly in the ointment for 2014. As long as the markets play along with the Fed’s deflation theme, as we expect they will as long as they can, the economy and markets will do just fine (this doesn’t mean there won’t be a correction in the equity markets, as we haven’t had a meaningful one for two years). But sooner, or later, something will have to be done about inflation. We will close this Part I with a quote from Jim Rogers, the commodity guru (Barron’s, October 12, 2013):
The price of nearly everything is going up. We have inflation in India, China, Norway, Australia – everywhere but the U.S. Bureau of Labor Statistics. I’m telling you, they’re lying.
December 20, 2013
Robert Barone, Ph.D.
Joshua Barone
Andrea Knapp Nolan
Dustin Goldade
Robert Barone (Ph.D., economics, Georgetown University) is a principal of Universal Value Advisors, Reno, a registered investment adviser. Barone is a former director of the Federal Home Loan Bank of San Francisco and is currently a director of Allied Mineral Products, Columbus, Ohio, AAA Northern California, Nevada, Utah Auto Club, and the associated AAA Insurance Co., where he chairs the investment committee. Barone or the professionals at UVA (Joshua Barone, Andrea Knapp and Marvin Grulli) are available to discuss client investment needs.
Call them at 775-284-7778.
Statistics and other information have been compiled from various sources. Universal Value Advisors believes the facts and information to be accurate and credible but makes no guarantee to the complete accuracy of this information.
Permalink
December 10, 2013
Posted in Uncategorized at 7:05 PM by Robert Barone
The mainstream business media continue to worry about a faltering economy, most notably of late, a fixation on the fear of a poor retail holiday shopping season. This makes one yearn for those good old days of a vibrant economy, like what we had in 2005-06. But wait! Except for the construction of new housing units and some problems measuring aggregate demand, the underlying data indicate that the good old days are back.
The top portion of the accompanying table shows various economic indicators for the three months ending in November, and it shows the average values of those same indicators during the 18 months of the pre-recession boom period ending June 30, 2006. The bottom part of the table is similar, but shows quarterly data.


Manufacturing and Trade
A quick perusal of the table shows that many of the economic indicators show up as strong or stronger than they were during the boom period. The ISM Manufacturing Index, for example, is nearly three points higher than the average of the previous boom. Industrial production is higher and capacity utilization is close. Freight car loadings are significantly higher. And while ISM’s Non-Manufacturing Index isn’t quite as hot as it was then, it still shows strong expansion. Elsewhere in the table, you can see that auto sales are nearly as frothy today as they were during the boom years.
Housing
Part of the reason that the economy is not overheating is housing. It is clear from the table that housing is significantly lagging 2005-06. The latest data, from August, show that current starts are about 43% of the 18-month average in 2005-06. But recognize that 2005-06 was the height of the housing bubble. Because new home construction has been in the doldrums for the past six years, the resurgence evident in the economy has pushed the median price of a new home north of what it was then. In addition, the lack of construction has put the months’ supply of new homes at less than three. In the housing bubble, the average level of supply was four months. So, given prices and supply, can a rise in starts be far behind? (Yes, I know,
interest rates have risen, but they are still really low by historic standards, and we seem to have a Fed committed to keeping them down.)
The Labor Markets
Because the unemployment rate indexes (see table) appear to be a lot higher today than in the boom period, the media assume that the labor markets are still loose. But demographics and incentives to work have changed over the past seven years. The labor subindicators in the table imply a much tighter labor market than the traditional unemployment indexes would lead one to believe. Recent new nonfarm payrolls are equivalent to their monthly gains back then. The most recent weekly initial jobless claims level was 298,000. It was below 300,000 for one week in September, but you have to go all the way back to May 2007 to find a number that low. Even the four-week
moving average shown in the table is below the 2005-06 average despite the distortions from the government shutdown. Even the Continuing Claims series is approaching the 2005-06 average. And the Layoffs and Discharges, Job Openings, and Jobs Hard to Fill indicators are at or near their boom levels.
The Aggregates and the Underground
So, while auto sales are booming, the labor markets are tight, manufacturing and services are expanding at or near their pre-recessions levels, why do the aggregates (Real GDP and Real Gross Domestic Income, GDI) appear so depressed.
One possible explanation for the lag in the aggregates is a growing underground economy. When
taxes rise and government regulations squeeze profit margins, more unreported “cash” sales occur, and there is an increase in barter (e.g., a manicure for an hour in the workout class). Furthermore, those collecting government aid (unemployment benefits, food stamps, etc.) may take employment at a lower wage rate if it is paid in cash and is not reported. In the end, the underlying economic indicators are much more reliable than the aggregated measures like GDP, as these tend to rely heavily on models, assumptions and guesses.
Implications
There are many implications that occur when the underlying strength of the economy is finally recognized. The only one I will mention here is that while
stock market corrections are normal, significant downdrafts like those of 2001 and 2009 don’t occur with a strong underlying economy.
Permalink
Next page


