December 10, 2013
Posted in Uncategorized at 7:05 PM by Robert Barone
The mainstream business media continue to worry about a faltering economy, most notably of late, a fixation on the fear of a poor retail holiday shopping season. This makes one yearn for those good old days of a vibrant economy, like what we had in 2005-06. But wait! Except for the construction of new housing units and some problems measuring aggregate demand, the underlying data indicate that the good old days are back.
The top portion of the accompanying table shows various economic indicators for the three months ending in November, and it shows the average values of those same indicators during the 18 months of the pre-recession boom period ending June 30, 2006. The bottom part of the table is similar, but shows quarterly data.


Manufacturing and Trade
A quick perusal of the table shows that many of the economic indicators show up as strong or stronger than they were during the boom period. The ISM Manufacturing Index, for example, is nearly three points higher than the average of the previous boom. Industrial production is higher and capacity utilization is close. Freight car loadings are significantly higher. And while ISM’s Non-Manufacturing Index isn’t quite as hot as it was then, it still shows strong expansion. Elsewhere in the table, you can see that auto sales are nearly as frothy today as they were during the boom years.
Housing
Part of the reason that the economy is not overheating is housing. It is clear from the table that housing is significantly lagging 2005-06. The latest data, from August, show that current starts are about 43% of the 18-month average in 2005-06. But recognize that 2005-06 was the height of the housing bubble. Because new home construction has been in the doldrums for the past six years, the resurgence evident in the economy has pushed the median price of a new home north of what it was then. In addition, the lack of construction has put the months’ supply of new homes at less than three. In the housing bubble, the average level of supply was four months. So, given prices and supply, can a rise in starts be far behind? (Yes, I know,
interest rates have risen, but they are still really low by historic standards, and we seem to have a Fed committed to keeping them down.)
The Labor Markets
Because the unemployment rate indexes (see table) appear to be a lot higher today than in the boom period, the media assume that the labor markets are still loose. But demographics and incentives to work have changed over the past seven years. The labor subindicators in the table imply a much tighter labor market than the traditional unemployment indexes would lead one to believe. Recent new nonfarm payrolls are equivalent to their monthly gains back then. The most recent weekly initial jobless claims level was 298,000. It was below 300,000 for one week in September, but you have to go all the way back to May 2007 to find a number that low. Even the four-week
moving average shown in the table is below the 2005-06 average despite the distortions from the government shutdown. Even the Continuing Claims series is approaching the 2005-06 average. And the Layoffs and Discharges, Job Openings, and Jobs Hard to Fill indicators are at or near their boom levels.
The Aggregates and the Underground
So, while auto sales are booming, the labor markets are tight, manufacturing and services are expanding at or near their pre-recessions levels, why do the aggregates (Real GDP and Real Gross Domestic Income, GDI) appear so depressed.
One possible explanation for the lag in the aggregates is a growing underground economy. When
taxes rise and government regulations squeeze profit margins, more unreported “cash” sales occur, and there is an increase in barter (e.g., a manicure for an hour in the workout class). Furthermore, those collecting government aid (unemployment benefits, food stamps, etc.) may take employment at a lower wage rate if it is paid in cash and is not reported. In the end, the underlying economic indicators are much more reliable than the aggregated measures like GDP, as these tend to rely heavily on models, assumptions and guesses.
Implications
There are many implications that occur when the underlying strength of the economy is finally recognized. The only one I will mention here is that while
stock market corrections are normal, significant downdrafts like those of 2001 and 2009 don’t occur with a strong underlying economy.
Permalink
November 19, 2013
Posted in Banking, Big Banks, Bonds, Economy, Federal Reserve, Finance, Robert Barone, Uncategorized at 11:12 PM by Robert Barone
The Fed’s ‘Bizarro World,’ Part II

By Robert Barone, Ph.D
The “Seinfeld” TV comedy series (1989-98) had a set of episodes, known as “Jerry’s Bizarro World,” where everything “normal” was turned upside down and inside out. I have referred to this world in a previous column, and continue to find such Bizarro patterns in our real world.
The Fed was established in 1913 to act as a lender of last resort to a financial system that had been plagued with “panics” and deep recessions. At inception, its main policy tool was the “discount rate” and “discount window” where banks could submit eligible collateral to obtain needed liquidity when such options had dried up in the capital and financial markets.
Open market operations
Beginning in 1922, the Fed began to use a tool known as Open Market Operations (OMO), the buying and selling of government securities to add or subtract liquidity from the capital markets, reserves from the banking system, and to impact interest rates. OMO has traditionally been considered to be the Fed’s main policy tool. But that ended in late 2010 with the implementation of Quantitative Easing II (QE2).
In 2009, as the financial system was experiencing one of those financial panics, the Fed did what it was created to do, and provided liquidity to the markets where none was otherwise available. Many argue that Fed action via QE1 was instrumental in stabilizing the U.S. and world banking systems
Look at those excess reserves!
But, then, because the U.S. rebound from the ensuing recession was too slow, in late 2010 and again in 2012, the Fed announced more QE. Today, the latest figures show excess reserves in the banking system of $2.23 trillion. The reserves required on all of today’s existing deposits are $67 billion ($0.067 trillion). Today’s excess reserves are so massive that they can support 33 times current deposit levels without the Fed creating one more reserve dollar. Yet, with QE3, it continues to create $85 billion/month.
While they sit in an account at the Fed, excess bank reserves don’t directly influence economic activity. This, of course, has been the issue for the past five years. But, when banks do lend, the newly minted money gets into the private sector, impacting economic activity with the well-known “multiplier effect” described in money and banking textbooks. When such bank lending occurs, if the labor market is tight or there is little or no excess capacity in the business community, inflation ensues. Just think of how much money the banks can create if their current excess reserves are 33 times more than they need!
Sell side of OMO is impotent
So, how is the Fed going to control bank money creation in the future? They can’t use their most powerful traditional tool, OMO, because they would have to sell trillions of dollars of securities into the open markets before reserves would become a restricting issue for the banking system. The utterance of the word “tapering” last May sent rates up 100 basis points in a two-week period. This is just a taste of what would happen to interest rates if the Fed actually began to sell (instead of just buying a lesser amount, which is what “tapering” means).
Furthermore, long-term fiscal issues have become a real concern. With somewhere between $85 and $120 trillion of unfunded liabilities rapidly approaching as the population ages (as a comparison, annual U.S. GDP is only $16 trillion), huge fiscal deficits are a certainty barring entitlement, Social Security, Medicare and Medicaid reform. To keep the cost of the debt manageable within the U.S. government budget, the Fed must continue to keep interest rates low. With foreign criticism of U.S. policies on the rise, purchases of U.S. Treasury debt by foreign entities are likely to diminish in the future. That leaves the Fed as the major lender (lender of last resort!) to the Treasury via OMO purchases.
The borrowing window in reverse
Unable to use the “sell” side of OMO to influence the banking system, the Fed is now stuck with only one tool, the discount or borrowing window. Only now, because the financial system is drowning in the sea of liquidity, the borrowing window and discount rate must now work in reverse!
In the traditional use of the borrowing window, the Fed used the discount rate (short-term borrowing rate) to encourage (by lowering rates) or discourage (by raising rates) banks from borrowing to lend to the private sector. But, in today’s Bizarro World, the Fed will have to use the rate it pays (currently 0.25 percent/year) to the banks with excess reserves to encourage or discourage bank lending. Yes! Not the rate the banks pay to the Fed to borrow, but the rate the Fed pays to the banks to encourage them to keep their reserves instead of lending them. The original concept of the Fed as the lender of last resort has been turned on its head. It’s backward — it’s Bizarro!
Implications for investors
It is difficult for investors to deal with a system turned on its head. The bond market gets spooked whenever there is talk of the Fed “tapering” its bond purchases. The return on those bonds is simply too low for the risk involved, so the best advice here is to avoid them unless you are exceptionally skilled. That leaves equities — but that is a topic for another column in this new and Bizarro World.
Robert Barone (Ph.D., economics, Georgetown University) is a principal of Universal Value Advisors, Reno, a registered investment adviser. Barone is a former director of the Federal Home Loan Bank of San Francisco and is currently a director of Allied Mineral Products, Columbus, Ohio, AAA Northern California, Nevada, Utah Auto Club, and the associated AAA Insurance Co., where he chairs the investment committee. Barone or the professionals at UVA (Joshua Barone, Andrea Knapp, Matt Marcewicz and Marvin Grulli) are available to discuss client investment needs.
Call them at 775-284-7778.
Statistics and other information have been compiled from various sources. Universal Value Advisors believes the facts and information to be accurate and credible but makes no guarantee to the complete accuracy of this information.
Permalink
November 5, 2013
Posted in Federal Reserve, Finance, Uncategorized tagged Robert Barone (Ph.D. at 9:38 PM by Robert Barone
The Fed has proven to be a terrible caretaker of the responsibilities that come with reserve currency status, even while the U.S. economy benefits greatly from it. The bungling is so great that the dollar is now at risk of the loss of that status, and with it, those huge benefits.
Some history
After both world wars, the U.S. had the strongest economy. And despite FDR’s removal of the U.S. from the gold standard in 1933, the Bretton Woods agreements of 1944 established a “gold exchange” standard wherein balance of payment deficit nations were to settle up with surplus nations in gold (at $35 per ounce).
Under this system, when gold payment settlements were made, the gold never was physically shipped but simply “moved” in the holding vault to an area designated for the recipient country.
In 1971, Republican President Richard Nixon removed the world from the gold exchange standard when France demanded physical delivery. Since then, the dollar has served as the world’s reserve currency, with “trust” as the only underlying asset.
The perks of reserve status
Most international transactions today occur in dollars, even if none of the transacting parties is American. For example, if Hyundai (South Korea) sells autos to a business in Argentina, the buyer must first convert the Argentina peso to dollars to pay for the autos. Hyundai can either hold the dollars, or convert them to their home currency (Won).
Note that this transaction has little to do with U.S. economic activity. Yet, it means that there has to be a lot of dollars floating around to support worldwide trade.
The reserve currency status and trust in the U.S. dollar has resulted in the U.S. government’s ability to overspend and issue debt because of the demand for dollars in international trade.
On the other hand, when an emerging economy’s government runs a large and systemic deficit, there are serious fiscal consequences. The value of the currency immediately falls, inflation occurs and the markets force up interest rates, thus impacting that economy’s economic growth.
The reserve currency status and the accompanying trust in the currency also have resulted in the investment of excess dollars in the international system back into U.S. Treasury securities, allowing the Treasury to run large deficits without significant consequences for the currency’s value.
Emerging pressures
Of course, we’ve all heard stories that countries like China and Russia have been advocating that the world adopt a different reserve currency. Many dismiss China’s and Russia’s positions as political rants. But these gripes are legitimate, and unless they are changed, the existing monetary and fiscal policies in the U.S. eventually will move the world toward an alternative reserve currency system.
Policy impacts
While Congress has played a major role, the Fed in particular has been irresponsible as the caretaker of the world’s reserve currency. Because the U.S. never openly asked that the dollar be the reserve currency, the Fed maintains that its only interest is in America’s economic performance. But Fed policies, such as quantitative easing, have huge consequences worldwide.
For example, when the Fed tells the capital markets that interest rates will be 0 percent for an “extended period,” as it did in 2012, hedge funds borrow dollars at minuscule yields and send unwanted dollars to higher-yielding emerging market economies.
Those capital movements have been monstrous, often overwhelming the emerging economy’s underdeveloped financial system, causing inflation in the local economy along with rising interest rates and slowing economic growth.
Then, last May, when Fed Chairman Ben Bernanke used the word “taper,” those huge flows, which had built up over a period of months, almost instantaneously reversed as the hedge funds raced to repay their borrowings before interest rates rose further.
Robert Barone (Ph.D., economics, Georgetown University) is a principal of Universal Value Advisors, Reno, a registered investment adviser. Barone is a former director of the Federal Home Loan Bank of San Francisco and is currently a director of Allied Mineral Products, Columbus, Ohio, AAA Northern California, Nevada, Utah Auto Club, and the associated AAA Insurance Co., where he chairs the investment committee. Barone or the professionals at UVA (Joshua Barone, Andrea Knapp, Matt Marcewicz and Marvin Grulli) are available to discuss client investment needs.
Call them at 775-284-7778.
Statistics and other information have been compiled from various sources. Universal Value Advisors believes the facts and information to be accurate and credible but makes no guarantee to the complete accuracy of this information.
Permalink
October 21, 2013
Posted in Uncategorized tagged congress, growth rate, Robert Barone, uncategorized at 8:37 PM by Robert Barone
A few things became clearer during the recently ended federal government “shutdown” and debt ceiling crisis:
1. Our political system has deteriorated to the point where each side of the political spectrum is willing to push to the very brink of disaster before even the most basic remedial action is taken.
2. The “level” of the debt is really not the issue; it is the growth rate of that debt relative to the growth of the economy.
These issues raise the level of uncertainty in the economy and therefore stymie private-sector growth and job creation.
Spending projections
All credible projections of federal spending show that Social Security, Medicare/Medicaid and other social spending programs will explode in the coming years unless Congress and the president do something to fix the situation.
In 1982, projections were that Social Security faced insolvency by 1990. But, that didn’t happen because President Reagan and House Speaker Tip O’Neill reached a compromise and a solutionthat kept the Social Security program viable for a while longer.
To the brink
When Congress and the president confront the spending issues, their choices will be to raise taxes, reduce benefits or, via compromise, some combination of the two.
But we know that they won’t act until the spending issues become a recognizable crisis and/or their political futures require that they act. This is most likely to come in the form of “invisible hand” economic actions wherein the dollar drops in value relative to other currencies and interest rates rise, as the international community relies less and less on the dollar as the world’s reserve currency.
China and Russia are becoming more and more vocal and active in seeking alternatives to the dollar in world trade. If the necessary spending controls aren’t soon put in place, the U.S. economy could lose its premier status. Don’t underestimate the importance of the “reserve currency” status in the economic growth equation.
The reality of the debt
One argument in the current bickering is that the country will never be able to repay the $17 trillion of debt it has accumulated. From an economic point of view, the debt level itself isn’t the issue. The issue is how fast that debt is growing and its cost.
Unlike an individual whose debts all come due upon death(either the estate pays the debt off or the lender(s) writes it off), a country doesn’t die (without a revolution). As long as the growth rate of the debt is less than the growth rate of the economy, and as long as interest rates remain reasonable, the debt will never be expected to be repaid.
From this point of view, the most significant single statistic is the debt’s relationship to GDP. The concept is similar to that of an application for a mortgage. The borrower needs a reasonable “debt payment/income ratio” to qualify. The more pre-existing debt one has, and the more of one’s income it takes to service that debt, the less credit worthy the individual becomes.
Debt/GDP history
After World War II, the debt/GDP ratio was 120 percent. Why wasn’t it a disaster then? The answer: 1) the war had ended and spending was reduced; and 2) the economy grew faster than the debt.
By 1974, the debt/GDP ratio had fallen to 32 percent. It rose after that to 66 percent in 1996 after the recession of the early ’90s, but fell to 56 percent during the strong economic growth years of the late ’90s and the spending-control emphasis of the Congress (which was accepted and then embraced by President Bill Clinton).
By 2008, as a result of the 2001 recession and debt growth outpacing economic growth during the Bush presidency, the ratio rose to 70 percent. Then came the financial crisis and the recession with weak economic growth in its aftermath. The debt/GDP ratio now stands at more than 100 percent, a level that makes the international community nervous.
Conclusion
There are two key concepts here: 1) controlling the size of the fiscal deficit to control the growth rate of the debt (this implies confronting the growth rate of the social programs); and 2) growing the economy fast enough to accommodate a rising level of debt.
Spending, entitlement growth, the growth of the debt and economic growth are all intertwined. Since the spending issues were taken off the table in this week’s debt ceiling bill, the only chance at avoiding a true debt crisis is for the economy to grow.
The so-called “resolution” reopens the government only through Jan. 15 and increases the debt ceiling only until Feb. 7. Businesses are asking, “Are we going to relive this debacle all over again in three months?”
Such uncertainty clearly shows up in all of the business surveys as holding back economic growth and job creation. For everyone’s benefit, it behooves Washington to put some degree of certainty back into the business markets, at least for a long-enough time period to allow a return on new capital deployment.
The longer-term question is whether or not federal spending growth will allow the debt/GDP ratio to decline. If it does, then the fiscal issues in Washington, D.C., will disappear, just as they did post-World War II.
Unfortunately, the current way the government runs almost guarantees that spending will continue to probe the limits of the debt/GDP ratio. If this doesn’t change, one might want to prepare for those “invisible hand” economic implications.
Robert Barone (Ph.D., economics, Georgetown University) is a principal of Universal Value Advisors, Reno, a registered investment adviser. Barone is a former director of the Federal Home Loan Bank of San Francisco and is currently a director of Allied Mineral Products, Columbus, Ohio, AAA Northern California, Nevada, Utah Auto Club, and the associated AAA Insurance Co., where he chairs the investment committee. Barone or the professionals at UVA (Joshua Barone, Andrea Knapp, Matt Marcewicz and Marvin Grulli) are available to discuss client investment needs.
Call them at 775-284-7778.
Statistics and other information have been compiled from various sources. Universal Value Advisors believes the facts and information to be accurate and credible but makes no guarantee to the complete accuracy of this information.
Permalink
October 16, 2013
Posted in Economy, Robert Barone, Uncategorized tagged Debt, GDP at 9:48 PM by Robert Barone
All credible projections of federal spending show entitlements, especially Social Security and Medicare/Medicaid, exploding in coming years — unless, that is, Congress and the President do something to fix the situation.
In 1982, projections were that Social Security faced insolvency by 1990. But that didn’t happen because President Reagan and House Speaker Tip O’Neill reached a compromise and a solution that kept the Social Security program viable for a while longer.
Today, due to demographic and other factors, the growth rate of Social Security, Medicare/Medicaid and the other entitlements has budget-busting and debt-level implications that have caused consternation and uncertainty in the business community and financial markets.
When Congress and President Obama will be forced to confront the spending issues, their choices will be: raising taxes, reducing benefits or, via compromise, some combination of the two. But we know they won’t act until the spending issues become a recognizable crisis and their political futures require action.
This is most likely to come in the form of “invisible hand” economic actions wherein the dollar drops in value relative to other currencies and interest rates rise as the international community relies less and less on the dollar as the world’s reserve currency. If that doesn’t cause enough political pressure to bring about the necessary spending controls, then the U.S. economy may well lose its premier status.
The Reality of the Debt
One argument in the current bickering is the country will never be able to repay the $17 trillion of debt it has accumulated. From an economic point of view, the debt level itself isn’t the issue. The issue is how fast that debt is growing and its cost.
Unlike an individual whose debts all come due upon death (either the estate pays the debt off, or the lender(s) writes it off), a country doesn’t die. As long as the growth rate of the debt is less than the growth rate of the economy, and as long as interest rates remain reasonable, the debt will never have to be repaid. From this point of view, the most significant single statistic with regard to the debt is its relationship to GDP.
The concept is similar to that of an application for a mortgage. The borrower needs a reasonable “debt payment/income ratio” to qualify. The more pre-existing debt one has, and the more of one’s income it takes to service that debt, the less creditworthy the individual becomes.
After World War II, the debt to GDP ratio was 120%. Why wasn’t it a disaster then? The answer: 1) the war had ended and spending was reduced and 2) the economy grew faster than the debt. By 1974, the debt to GDP ratio had fallen to 32%. It rose after that, to 66% in 1996 after the recession of the early 1990s. Then it fell to 56% during the strong economic growth years of the late 1990s and the spending control emphasis of the Congress — which was accepted and then embraced by President Clinton.
By 2008, as a result of debt growth outpacing economic growth during the George W. Bush presidency, the ratio rose to 70%. Then came the financial crisis and Great Recession, with weak economic growth in its aftermath. The debt to GDP ratio now stands at more than 100%, a level that makes the international community nervous.
Conclusion
There are two key concepts here: 1) controlling the size of the fiscal deficit to control the growth rate of the debt (this implies confronting the entitlement growth issues) and 2) growing the economy fast enough to accommodate a rising level of debt (which implies that the rate of economic growth be faster than the growth rate of the debt).
Spending, entitlement growth, the growth of the debt and economic growth are all interrelated. If confronting the entitlement issues is off the table in the current political negotiations, as it appears to be, then the only chance at avoiding a true debt crisis is for the economy to grow.
The longer the politicians bicker about the budget, taxes and spending, the more that uncertainty will hold back economic growth. That clearly shows up in all of the business surveys.
For everyone’s benefit, it behooves Washington to put some degree of certainty back into the business markets, at least for a time period that will allow a return on new capital deployment.
The longer-term question is whether or not federal spending growth will allow the debt to GDP ratio to decline. If it does, then the fiscal issues in Washington will disappear, just as they did post-World War II. If it doesn’t, one should prepare for those “invisible hand” economic implications.
Robert Barone (Ph.D., economics, Georgetown University) is a principal of Universal Value Advisors, Reno, a registered investment adviser. Barone is a former director of the Federal Home Loan Bank of San Francisco and is currently a director of Allied Mineral Products, Columbus, Ohio, AAA Northern California, Nevada, Utah Auto Club, and the associated AAA Insurance Co., where he chairs the investment committee. Barone or the professionals at UVA (Joshua Barone, Andrea Knapp, Matt Marcewicz and Marvin Grulli) are available to discuss client investment needs.
Call them at 775-284-7778.
Statistics and other information have been compiled from various sources. Universal Value Advisors believes the facts and information to be accurate and credible but makes no guarantee to the complete accuracy of this information.
Permalink
October 8, 2013
Posted in government, Robert Barone, Uncategorized tagged employment, shutdown at 4:37 PM by Robert Barone
I was quite surprised when I got up last Tuesday to find that all of my utilities were working, including TV; my trash had been picked up; and, when I drove to work, the traffic lights were operating, the schools were open and I even spotted a couple of local police patrol cars.
It appeared to be a normal Tuesday morning.Well, I wasn’t really surprised. But I would have been if I believed the media’s vision, which had built to a crescendo on Monday, that the so-called “shutdown” was going to be an unmitigated disaster.
By Wednesday, as far as I could tell, the national parks had closed, as had some museums and monuments in Washington, D.C. I am also informed that some data releases (like September’s unemployment rate) will be delayed. But, all in all, there hasn’t been much impact on my daily life and probably not on yours, either.
Now, I am not making light of the issue, as it will definitely have an impact if prolonged. (Actually, the upcoming debt ceiling issue has much more potential to do damage.) But the fact that there was no real immediate impact on most Americans’ lives makes one realize that state and local government services play a much larger role in our daily lives than federal government services do.
Government approaches
Since the financial crisis, governments at all levels have struggled either because they cannot control spending or, more likely, have made future commitments that they simply cannot meet.
During such times of financial stress, state and local governments typically take one of two approaches, or even a combination:
• The preferred approach is for government to work with the private sector to promote business and employment growth. In the long run, a healthy and growing private sector generates more tax revenue. You don’t have to raise the rates to accomplish this.
• The second way, which is simply wrongheaded, is to increase taxes and fees on the current citizenry. In the long run, this drives business away and the revenue issues remain or even get worse.
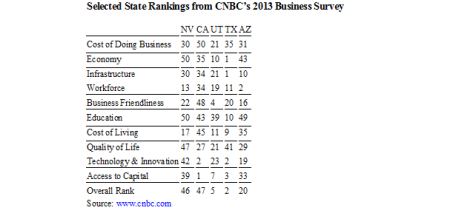
CNBC survey
Every year, CNBC and others such as Forbes do surveys of which states are best for private-sector businesses.The accompanying table shows the results of the 2013 CNBC survey for the Western states with which Nevada competes for business relocations (Arizona, Utah, Texas). I also threw in California because many relocations originate there. Nevada’s overall ranking is 46th out of 50. Nevada has been ranked between 45 and 47 at least since ’08.
Looking at the table, Nevada generally ranks poorly in every category, most notably economy, education, quality of life and technology and innovation.
Nevada’s lackluster record
To its credit, the governor and the Nevada Legislature approved a $10 million fund that targets cutting-edge technologies, modeled after a similar and successful effort in Utah.
But state and local governments can do much more. Economic growth in the state would improve if officials reduced the cost of being in business and improved business friendliness via a reduction in fees and regulations. I estimate that if such improvements were made, the state could move up significantly in the CNBC survey.
Some would think this impossible. Not so. Despite the Detroit bankruptcy, over the last four years, state and local governments in Michigan have moved that state from a rank of 41st (’09) to a rank of 29th in the latest survey. There, governments aggressively go after business relocations and become partners, not antagonists.
The record in Nevada is not good. Except for the cutting-edge technology fund, state and local legislators have opted for raising fees and taxes. Here are some examples:
• Since the financial crisis, the state has doubled the business license fee, and most of the local governments have followed suit.
• Assembly Bill 46, passed by the recent “no new taxes” Legislature, permits the local governments to raise taxes without the constitutional requirement of a two-thirds vote of the Legislature. While its constitutionality has yet to be tested, AB46 is an example of how government works today — by sleight of hand.
• In Reno, it costs more than $50,000 in permit fees to build a 3,000-square-foot building.
• Anyone who owns a small business in Northern Nevada can attest to the significant increase in fees and regulations since the crisis.
Conclusion
We are lucky that California is our neighbor, as it ranks last in the cost of doing business, is 48th out of 50 in business friendliness and 45th in cost of living. Overall, it is ranked 47th, one place lower than Nevada. And, while businesses are leaving California in droves and some are relocating to Nevada, the state could be getting a much larger share if it was more business-friendly.
Robert Barone (Ph.D., economics, Georgetown University) is a principal of Universal Value Advisors, Reno, a registered investment adviser. Barone is a former director of the Federal Home Loan Bank of San Francisco and is currently a director of Allied Mineral Products, Columbus, Ohio, AAA Northern California, Nevada, Utah Auto Club, and the associated AAA Insurance Co., where he chairs the investment committee. Barone or the professionals at UVA (Joshua Barone, Andrea Knapp, Matt Marcewicz and Marvin Grulli) are available to discuss client investment needs.
Call them at 775-284-7778.
Statistics and other information have been compiled from various sources. Universal Value Advisors believes the facts and information to be accurate and credible but makes no guarantee to the complete accuracy of this information.
Permalink
Posted in business, Robert Barone, Uncategorized tagged Middle East, sales results at 3:47 PM by Robert Barone
The markets have been fixated on the political standoff in Washington, D.C. Through Friday, October 4th, the S&P 500 was down in 9 of its last 12 sessions. The uncertainty, especially over the debt ceiling and possible “default,” has made investors hesitant to make longer-term commitments with their investible funds. Nevertheless, the data from the private sector, especially of late, has been much stronger than earlier in the year.
Consider:
The manufacturing sector is hot. The Institute for Supply Management (ISM) manufacturing index was 56.2 in September, the highest in nearly 2.5 years. In the U.S., we are seeing a manufacturing renaissance as labor cost increases in China and much of Asia are running in excess of 10% annually. As an example of what is going on in manufacturing, 9 of GM’s 17 production plants are operating flat out on an around the clock (3 shift) schedule. In 2008, at the last auto peak, only 3 of the then 20 plants were operating at full capacity. In August, auto sales were 16.1 million units (SAAR – seasonally adjusted annual rate), a level not seen since before the financial crisis. Sales fell back in September to 15.3 million units (SAAR) but only because the Labor Day holiday was on Monday, September 2nd and some weekend sales were pulled into the August numbers. The average of the two months, 15.7 million units (SAAR) isn’t anything to sneer at.
In the labor markets, employers are having a hard time finding qualified applicants. This is quite a different market than it was even 2 years ago. First time filers for unemployment insurance are at levels not seen since ’07, and this particular economic series has a high inverse correlation with stock prices, i.e., when claims fall, stock prices rise. Voluntary quits are also up significantly indicating that current employees are getting more confident that they can find new employment. And, despite the secular downtrend in the labor force participation rate, a labor shortage is developing.
While suffering a setback due to higher mortgage rates this summer, the housing market still suffers from a lack of supply. This isn’t surprising given that we have had only minimal new housing construction for the past half decade while population growth has continued. As a result, there has been a double digit rise in home values over the past 12 months, which makes middle class homeowners more confident and more willing to spend and take on debt. We see this in the consumer sentiment surveys, in the growth of credit card debt, and in new auto financings
The U.S. economy is mainly service based, so the ISM non-manufacturing index is an important indicator of economic health. In August, that index hit 62.2, the highest level since early 2011, a time when GDP was expanding faster than 3%. Not to get too excited, the index fell back to 55.1 in September. Nevertheless, that is still a healthy result. By definition, anything over 50.0 signals growth.
The worry over China (which embodies Australia, Canada, and others which supply China much of its raw materials) now seems overdone. While economic growth is much lower than in the past decade, 7.5% is still much faster than anything the mature economies could hope for. There was no “hard landing” there, and indications are that growth has resumed. This is positive for exports and international large cap companies. In addition, Europe’s economy appears to have bottomed.
Meanwhile, the Federal Reserve and other central banks have kept the monetary spigots open, and, because of the so-called “crisis” issues in Washington, D.C., it seems unlikely that Bernanke will begin to “taper” money before year’s end. In addition, and just as an historical note, in the post-WWII era, every recession has been preceded by a significant “tightening” of monetary policy (i.e., yield curve inversion where short-term rates are higher than long-term ones). As indicated above, it appears we are a long way from that. Normally, when the economy grows and monetary policy is still easy, stock prices rise.
Don’t get me wrong. The long-term outlook is still clouded. Middle East tensions persist, terrorism, led by Al-Qaeda, is not dead, and U.S. influence in the world is waning. In addition, the long-term struggle with debt, its costs, and entitlements in the U.S. and Europe still hasn’t been dealt with. Nor has risk in the financial system been removed. This is true for the U.S., but especially true for Europe.
But, if the debt ceiling is raised without a U.S. default (which is the highly likely scenario), markets will have a relief rally, and, at least for the short-term, concerns over those nasty long-term issues will be put on the back burner. Remember, rising markets often climb a “wall of worry.” Perhaps, the political antics now playing out in Washington, D.C., especially if they push the default issue to the precipice, will ultimately give investors a buying opportunity in the equity markets.
Robert Barone (Ph.D., economics, Georgetown University) is a principal of Universal Value Advisors, Reno, a registered investment adviser. Barone is a former director of the Federal Home Loan Bank of San Francisco and is currently a director of Allied Mineral Products, Columbus, Ohio, AAA Northern California, Nevada, Utah Auto Club, and the associated AAA Insurance Co., where he chairs the investment committee. Barone or the professionals at UVA (Joshua Barone, Andrea Knapp, Matt Marcewicz and Marvin Grulli) are available to discuss client investment needs.
Call them at 775-284-7778.
Statistics and other information have been compiled from various sources. Universal Value Advisors believes the facts and information to be accurate and credible but makes no guarantee to the complete accuracy of this information.
Permalink
September 23, 2013
Posted in Federal Reserve, Markets, Robert Barone, Uncategorized tagged employment, Robert Barone at 7:59 PM by Robert Barone
NEW YORK (TheStreet) — After nearly eight years of trying to make the Federal Reserve more transparent, in one stroke Chairman Ben Bernanke has undone much of that effort.
In May, he telegraphed the “taper” of the Fed’s “Large Scale Asset Purchase” program (known as LSAP to Fed economists and quantitative easing, or QE, to Wall Street) based on a strengthening economy and labor market.
The market reacted by pushing 10-year Treasury yields to nearly 3% from 1.6%, one of the most rapid backups in yields on record. Then, in the face of that strengthening economy and labor markets, last Wednesday, Bernanke pulled the rug out.
The Data: Except for the Bureau of Labor Statistics’ (BLS) August unemployment report, almost all of the underlying data underscore a strengthening economy. Both ISM manufacturing and non-manufacturing indexes for August were strong, with the non-manufacturing index setting a record high. The employment sub-indexes were no exceptions. Initial unemployment claims have been in a steady and steep downtrend since 2010.
The week of Sept. 7 saw this number at 294,000, a number not seen since April 2006. The four-week moving average, considered more reliable, at 314,750, hasn’t been this low since October 2007. The Fed’s own economists have indicated that concerns over “structural” employment issues (i.e., labor force drop-outs) have been overdone. Job openings in the private sector are higher than at any time since 2008, and employers complain they cannot find qualified candidates.
Thus, based on labor market conditions, which Bernanke indicated was key, in conjunction with the lack of success of the LSAP programs in stimulating economic growth (also according to the Fed’s own economists), the “taper” should have occurred.
After months of “taper” talk and years of trying to promote transparency, last Wednesday, something else happened. We don’t know what it was — yet. Maybe we will find out soon, or maybe we will have to wait for Bernanke’s memoirs.
Here are some possibilities:
•The Fed misread the August employment report. This doesn’t seem possible. As outlined above, all of the underlying employment data are much stronger, not weaker than last spring. Also, the Fed knows that the BLS heavily massages the employment releases.
The concurrent seasonal adjustment process used by the BLS, where each month the entire year’s series is recalculated but not released to the public, makes it not only possible but highly probable that the weaker August release simply reflected catch-up from the frail first and second quarters. So, while the August BLS numbers could be used as an excuse, they surely cannot be the underlying reason.
•The market reaction to the May “taper” announcement was more than the Fed anticipated and interest rates backed up too fast. The Fed may be concerned over the impact of higher rates on the nascent housing recovery. After all, the QEs seem to be aimed squarely at housing (the purchase of Mortgage Backed Securities in QE3) and the equity markets. But if this were the case, the Fed could easily jawbone rates lower, even in the face of the initial taper. In fact, many market pundits thought that rates would fall if the “taper” amount was as anticipated ($10 billion to $15 billion).
•There is a third possibility, one that is purely speculative on my part: Bernanke has decided that he wants another four-year term as chairman. Of course, that requires a White House nomination. Recognizing that nothing happens in Washington that isn’t manipulated or controlled, the events of the past 10 days surrounding the Fed seem too coincidental not to be related.
It is clear that while the markets want Janet Yellen to be the next Fed chair, the White House is not keen on her. Perhaps the “no-tapering” announcement was the quid pro quo between Bernanke and the White House and that Lawrence Summers’ formal withdrawal of his name from consideration (quite unusual, since there was no formally announced candidate list) was part and parcel. After all, a rising stock market is always desirable for the White House’s occupant.
Conclusion: History will eventually sort all of this out. Meanwhile, one thing is clear: The eight years of effort to make the Fed more transparent and credible have been dealt a serious blow. Last Wednesday, with the “no-taper” announcement, the Dow Jones Industrial Average rose 147 points. Since then, it has fallen 226 points, with a loss of 185 on Friday, as the markets have begun to rethink the implications.
In the end, without Fed credibility, markets will be more uncertain and, therefore, more volatile.
Robert Barone (Ph.D., economics, Georgetown University) is a principal of Universal Value Advisors, Reno, a registered investment adviser. Barone is a former director of the Federal Home Loan Bank of San Francisco and is currently a director of Allied Mineral Products, Columbus, Ohio, AAA Northern California, Nevada, Utah Auto Club, and the associated AAA Insurance Co., where he chairs the investment committee. Barone or the professionals at UVA (Joshua Barone, Andrea Knapp, Matt Marcewicz and Marvin Grulli) are available to discuss client investment needs.
Call them at 775-284-7778.
Statistics and other information have been compiled from various sources. Universal Value Advisors believes the facts and information to be accurate and credible but makes no guarantee to the complete accuracy of this information.
Permalink
Posted in taxes, Uncategorized, Wall Street tagged economy, Robert Barone at 7:07 PM by Robert Barone
Despite what was widely viewed as a weak employment report in early September, the U.S. economy appears to be on solid footing. Both ISM manufacturing and nonmanufacturing indexes for August were strong, with the nonmanufacturing index setting a record high. Initial unemployment claims have been in a steady and steep downtrend since 2010. Job openings in the private sector are higher than at any time since 2008, and employers complain they cannot find qualified candidates. So, while we aren’t quite in a boom, put any thoughts of recession on the back burner. But, make no mistake, inflation lies ahead.
Political gridlock
The No. 1 reason for this inflation forecast is the inability of governments at all levels, but especially the federal government, to rein in spending. At least once each year, we are treated to a confrontation between left and right over budgeting, spending and the deficit. But, nothing is ever resolved — the can is just kicked further down the road. The table above uses Congressional Budget Office baseline forecasts, which are quite optimistic. The table displays the baked-in growth in federal spending as a percentage of total economic output (gross domestic product).
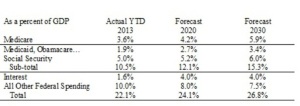
Sources: Heritage Foundation; Jeffrey Gundlach/Doubleline Funds; U.S. Debt Clock website; Congressional Budget Office
2020 is only six years away, and 2030 but 16. From 1959-2008, the average revenue of the federal government as a percentage of GDP was 18.1 percent. For 2013, year to date, it is 16.9 percent. To balance the budget in the next six years, current tax rates must rise 43 percent. To balance it by 2030, those tax rates have to rise 59 percent. And these data points come from optimistic CBO forecasts. In an economy that the Fed considers so sluggish so as to not start its “taper” process, it is unlikely that taxes can be raised to these levels. Furthermore, the middle class, which pays most of the taxes, is rapidly shrinking due to the stealth inflation that has sapped their purchasing power. And, of course, the political chasm and resulting gridlock between the left and right has made addressing the automatic growth in federal spending essentially impossible.
The big story of the week was the fact that the Fed decided to keep the pedal to the metal (the “no taper” announcement) and the rapid growth in its balance sheet, which, essentially, is the creation of money that the banking system can lend several times over, continues unabated at $85 billion per month. Wall Street, the main receptor of the Fed’s largesse, sent the equity averages to all-time highs. But the Fed’s credibility took a hit, especially since the chairman telegraphed the “taper” way back in May. The very next day (Thursday), both jobless claims and existing home sales showed a much stronger underlying economy than expected. The markets now are questioning the Fed’s ability to even read the underlying trends.
Since the financial crisis, the Fed’s balance sheet has grown about $3 trillion, from about $800 billion to more than $3.6 trillion. During that same time period, U.S. Treasury debt outstanding has grown from $10 trillion to $17 trillion. In effect, the Fed has “monetized” 43 percent of the new debt over this period. Given the growth in automatic federal spending, it appears that monetizing the debt will be a major function of the Fed.
Conclusions:
• The economy is stronger than the Fed thinks and the unemployment report intimated.
• This is the first Fed in modern history to advocate higher rates of inflation (2.5 percent). Don’t be fooled; do you think that when the official CPI reaches 2.5 percent, it will automatically stop there because that is the Fed’s target?
• The rapid growth in automatic federal spending over the next few years will require the Fed to continue its large-scale asset purchases, just to support the Treasury’s need to issue debt and to keep interest rates down. Otherwise, the cost of interest alone will overwhelm the federal budget. The alternative, much higher taxation, is not politically viable.
• Ultimately, the dollar will weaken as the world recognizes that dollar debasement is occurring. Note that on the day of the Fed “no taper” announcement, gold rose by $55 an ounce. Market players aren’t stupid.
• Meanwhile, enjoy the continuation of the Wall Street party. But, beware of the inflation hangover.
Robert Barone (Ph.D., economics, Georgetown University) is a principal of Universal Value Advisors, Reno, a registered investment adviser. Barone is a former director of the Federal Home Loan Bank of San Francisco and is currently a director of Allied Mineral Products, Columbus, Ohio, AAA Northern California, Nevada, Utah Auto Club, and the associated AAA Insurance Co., where he chairs the investment committee. Barone or the professionals at UVA (Joshua Barone, Andrea Knapp, Matt Marcewicz and Marvin Grulli) are available to discuss client investment needs.
Call them at 775-284-7778.
Statistics and other information have been compiled from various sources. Universal Value Advisors believes the facts and information to be accurate and credible but makes no guarantee to the complete accuracy of this information.
Permalink
September 9, 2013
Posted in Inflation, Uncategorized tagged Robert Barone, unemployment at 6:08 PM by Robert Barone
One of the most lamented statistics coming out of the employment data is that the shrinking labor force participation rate, not increased hiring, is causing the fall in the unemployment rate. Does this foreshadow a weakening economy? When raw data are manipulated, massaged and sent through computer systems that smooth, enhance and add and subtract from that data, their monthly movements are unlikely to be meaningful.
Massaged Data
As John Williams of Shadowstats.com has documented, we know we can’t believe the CPI-U as a measure of the cost of maintaining a standard of living, so why would we put a lot of credence in the monthly movement of the heavily massaged employment release?
After all, the Bureau of Labor Statistics employs a “Birth-Death” model that originated in the 1990s, which adds about 50,000 jobs per month because the sampling process does not adequately cover small business. Unfortunately, today’s economic conditions are different than those of the 1990s.
The BLS also recalculates seasonal factors every month (called “concurrent seasonal adjustment”). The process actually changes all of the past monthly data year to date. So, the September release of the August data actually changed all of the employment numbers back to January.
However, the BLS only reports two previous monthly revisions. As a result, it is possible that their latest data are simply catching the weakness of the first two quarters. Because of the data manipulation, it is highly unlikely that the employment numbers could catch a turning point in the economy.
Unmassaged Data
Rather than looking at the U.3 or U.6 unemployment series to get a gauge on the underlying employment strength, it may be more beneficial for investors to look at other employment data that is unmassaged.
The August ISM Manufacturing Index was 55.7 (49.0 in May, 50.9 in June, and 55.4 in July). Anything over 50 means expansion. The Employment sub-index was 53.3, down slightly from July’s 54.4, but up significantly from June’s 48.7.
The ISM Non-Manufacturing Index was 58.6. This is the highest reading in the history of the series (began January, ’08). The sub-index for employment in this series rose to 57.0 from 53.2 in July, and now showing growth for 13 straight months.
Initial claims for unemployment have been in a steady and steep downtrend since 2010. For the week of Aug. 24, they were 323,000. A year ago, they were 368,000, and over 400,000 in 2010 and 2011.
Just as a reference, this series was at the 320,000 level in 2007. A look at the continuing claims series shows a similar downtrend.
The JOLTS Report (Job Openings and Labor Turnover Survey) for the private sector shows a steep rise in job openings, now higher than at anytime since 2008; voluntary quits are on the rise; and layoffs and discharges are near the lows for the life of the index, which began in December 2000.
In the employment report itself, the workweek expanded by 0.1 hours and overtime jumped by 0.2 hours. In addition, average weekly earnings rose 0.5% in August (these are unmassaged data points).
There are two significant comments in the Fed’s just released Beige Book, a summary of trends from early July through late August, worth noting: 1) “Some firms have become increasingly willing to negotiate salaries;” 2) “Reports from a few Districts highlighted significant labor supply constraints, and, in some cases, large compensation increases for workers with specialized skills …”
Conclusions
When the whole picture is viewed: 1) there is a shrinking labor force; 2) aggregate demand is increasing; 3) skills are unavailable to fill the job openings (specialized skills are at a premium); 4) wages are beginning to rise; and 5) new investment by corporations over the past five years has been at at a five-decade low (they’ve kept it all in cash). This is a recipe for wage-induced, cost-push inflation and shrinking corporate margins.
Despite the employment report, the labor market has tightened and the economy is growing; as a result, expect the Fed to announce its “tapering” plan next week.
As we found out in the 1970s, once started, cost-push inflation is hard to contain. The Fed may soon get its wished-for 2.5% inflation rate (even using the downwardly biased CPI-U measure). However, the wage-induced inflation is not likely to stop at 2.5%, just because that is the Fed’s target!
Robert Barone (Ph.D., economics, Georgetown University) is a principal of Universal Value Advisors, Reno, a registered investment adviser. Barone is a former director of the Federal Home Loan Bank of San Francisco and is currently a director of Allied Mineral Products, Columbus, Ohio, AAA Northern California, Nevada, Utah Auto Club, and the associated AAA Insurance Co., where he chairs the investment committee. Barone or the professionals at UVA (Joshua Barone, Andrea Knapp, Matt Marcewicz and Marvin Grulli) are available to discuss client investment needs.
Call them at 775-284-7778.
Statistics and other information have been compiled from various sources. Universal Value Advisors believes the facts and information to be accurate and credible but makes no guarantee to the complete accuracy of this information.
Permalink
Next page


