February 24, 2014
Posted in asset inflation, Banking, Big Banks, CPI, Federal Reserve, Inflation, investment advisor, investment banking, Markets, Nevada, Quantitative Easing, Real Estate, Robert Barone, Wall Street at 8:55 PM by Robert Barone
One of today’s economic myths is that the money that the Federal Reserve has created through its quantitative easing programs has not found its way into the money supply, and, as a result, no significant inflation has occurred.
The theory is that QE has only resulted in bank reserve creation, but little new money. Money and Banking 101 takes students through the “money multiplier” concept, where $1 of excess reserves can turn into $10 of new money if reserve requirements are 10%. Because there has been little net new bank lending since the Great Recession, the conclusion has been that there has been little money growth, and, therefore, minuscule inflation.
Those who tout this theory simply don’t understand how the money creation process works. In addition, inflation isn’t just measured by the narrowly defined and downwardly biased Consumer Price Index. Inflation means prices are rising, and, as I show below, we have plenty of that.
Money Creation
To show how the process actually works, assume that Citizen X buys $100,000 of securities from Citizen Y, and pays for it with a check drawn on X’s account at Bank XX. Citizen Y deposits the check in Bank YY. In this example, no new money has been created. An existing deposit at Bank XX was transferred to Bank YY.
Now assume that the Fed is the buyer of the $100,000 asset from Citizen Y. When Y deposits the check into his or her account at Bank YY, reserves in the banking system do rise by $100,000 as Bank YY ends up with a new deposit at the Fed.
But, also note that Citizen Y now has $100,000 in a deposit at Bank YY, a deposit that did not exist in the banking system prior to the transaction. Going back to Money and Banking 101, while the $100,000 may not be “multiplied” into $1,000,000 because the banks aren’t lending, the first step — the creation of $100,000 — did, indeed, occur.
The explosion in the assets on the Fed’s balance sheet of more than $3.3 trillion since the beginning of the QE process has resulted in the creation of at least that much new money. Using a back-of-the-envelope calculation, the change in currency in circulation as well as demand and savings deposits at commercial banks since the start of QE has been about $4.2 trillion. Net loan growth at those institutions has been about $1.1 trillion.The $3.1 trillion difference is, as expected, close to the growth of the Fed’s balance sheet.
Asset Inflation
So, why haven’t we had inflation if the money supply has grown so much? Well, we actually have had inflation. The only place we don’t find it is in the Bureau of Labor Statistics’ CPI calculation.
But, rather than dwelling on this single measure, consider that the form that inflation — rising prices — takes very much depends on what Citizen Y does with the newly created money, and what those who receive the money from Y do with it. More concretely, the Fed purchases from the large Wall Street institutions. So, it is likely that we will find inflation if we followed the path of the newly created money from those institutions.
As I have been discussing, about 25% of the newly created money over the past five years has gone into net new lending. Where did the rest of it go? It is a pretty sure bet that, given that these are Wall Street banks, much of it went into the equity and real estate markets. Equity prices as measured by the S&P 500 have risen by 150% over the five-year period, and by 29.6% in 2013 alone. Meanwhile, real estate prices as measured by the Case-Shiller 20-City Composite rose 13.7% last year.
It is also a pretty sure bet that the newly created money found its way into the emerging markets, where interest rates have been higher and the Fed’s promise of low U.S. rates for a long period of time (known as the “carry-trade”) significantly reduced the risk of the trade.
The latest 12-month official data show that inflation in Brazil is 5.6%, in India 8.8%, in Indonesia 8.2% and in Turkey 7.8%. Of course, we are all aware that the currencies of these countries have been crushed over the past six weeks, as hedge funds and other large investors have, en masse, withdrawn their funds as the prospect of a Fed tapering has become reality, along with expected rising rates.
Despite the so-called taper, the Fed continues to create a huge amount of money each month. Currently it’s $65 billion. This money has to find a home. It appears to be more than coincidental that, despite a 5.75% mini-correction in the equity market in January, prices have once again continued their upward trek.
Conclusion
More than $3 trillion of new money has been created by the Fed. It is sloshing around and causing prices to rise in equities, real estate and, until recently, in emerging markets. The money now coming out of the EMs will find another investment, causing those asset prices to rise.
We have inflation: asset inflation. The Fed continues to create money which finds its way into the financial markets. Is it any wonder why Wall Street loves QE and hangs on every word from the Fed? If history is any guide, asset inflation will continue as long as the Fed is printing. Just think what could happen to the money supply and inflation if the banks actually start to lend again.
And what might happen to asset prices if the Fed ever started to tighten?
Robert Barone (Ph.D., economics, Georgetown University) is a principal of Universal Value Advisors, Reno, a registered investment adviser. Barone is a former director of the Federal Home Loan Bank of San Francisco and is currently a director of Allied Mineral Products, Columbus, Ohio, AAA Northern California, Nevada, Utah Auto Club, and the associated AAA Insurance Co., where he chairs the investment committee. Contact Robert Barone or the professionals at UVA (Joshua Barone and Andrea Knapp) are available to discuss client investment needs. Call them at 775-284-7778.
Statistics and other information have been compiled from various sources. Universal Value Advisors believes the facts and information to be accurate and credible but makes no guarantee to the complete accuracy of this information.
Permalink
February 12, 2014
Posted in Banking, Capital, CBO, Congressional budget office, deflation, Economic Growth, Economy, emerging markets, establishment survey, Europe, Finance, GDP, Inflation, investment advisor, investment banking, investments, job market, labor force, Labor Market, obamacare, payroll tax reductions, Robert Barone, small business, Unemployment at 5:18 PM by Robert Barone
In countries where central banks are printing money, such as the US, UK, eurozone, and Japan, deflation is the fear. On the other hand, inflation is high in countries where central banks have followed more traditional policies, like Brazil (official inflation 5.9%), India (11.5%), Indonesia (8.4%), and Turkey (7.4%). One explanation is the carry trade. Because the central banks of the developed world promised low rates for the long term, the liquidity created by those central banks found its way into the economies of the emerging markets (EM) (read: borrow at low interest rates, invest at high ones). Unfortunately, most of those funds did not find their way into capital investment in those markets, but was instead used for consumption, which has played havoc with EM trade balances. When the demand side (usually measured by GDP) outstrips the supply side (potential GDP), inflation occurs. Now that the bubble in EM countries, caused by excess liquidity in the developed world, is starting to burst — investors no longer believe the carry trade will last much longer — what will become of all of that liquidity?
On February 4, the Congressional Budget Office (CBO), a supposed non-partisan government agency, released a shocking report, “The Budget and Economic Outlook: 2014 to 2024,” projecting that over the next 10 years the Affordable Care Act, commonly referred to as Obamacare, would reduce future employment rolls by more than 2.3 million. Overlooked in that report is the CBO’s projection that “potential” GDP in the US will be much slower over the next 10-year period than it has averaged since 1950; this in an age of innovation where rapid change is considered normal. The CBO says that “changes in people’s economic incentives caused by federal tax and spending policies set in current law are expected to reduce the number of hours worked…” and “that estimate largely reflects changes in labor hours worked owing to the ACA [Affordable Care Act].”
In the US, if the current gap between real GDP and potential GDP closes (and the so-called “slack” in the economy disappears as the CBO projects it will), then, just like in the EMs, any growth on the demand side of GDP above potential GDP, ends up, by definition, as inflation.
There are a many measures that indicate that the economy is much closer to its potential than is generally assumed. One such measure is the fact that, despite record levels of cash flow (used mainly for stock buybacks or dividends), for the past five years, corporations have not reinvested in their plant and equipment. According to David Rosenberg (Gluskin-Sheff), the average age of the capital stock in the US is almost 22 years, an average not seen since 1958. Given the fact that the cost of capital is near an all-time low, there is something holding back such investment. Rosenberg speculates that it is likely found in overregulation and the uncertainty regarding tax policy. An old and aging capital stock implies a much lower growth rate of potential GDP than in the past when the capital stock was younger.
The second issue is the labor force. While the December and January Establishment Survey disappointed the markets (December’s survey reported 75,000 jobs added; January saw a gain of 113,000), nobody is talking about the Household Survey. This is the survey from which the “official” unemployment rate is calculated. While more volatile that the Establishment Survey, the Household Survey showed gains of 143,000 jobs in December and a whopping 638,000 in January. When combined with other surveys (NFIB) which show that 23% of small businesses have at least one open position that they cannot fill (a six-year high according to Rosenberg), and that there is a sustained uptrend in voluntary quits, it would appear that the Establishment Survey is the outlier and that the labor market is quite tight.
If, indeed, the CBO is correct and potential GDP growth will slow over the next 10 years due to Obamacare, a tight labor market in conjunction with old capital stock will only exacerbate that situation. Since the financial crisis, the unemployment rate has fallen from 10.0% in October ’09 to 6.6% in January ’14, a 3.4 percentage point decline. During that period of time, the annual GDP growth rate has been about 2.4%. After the recession of the ’90s, to get the unemployment rate to fall 3.4 percentage points (from 7.8% to 4.4%), it took an annualized GDP growth rate of 3.7%. The lower GDP growth required to reduce the unemployment rate implies that the gap between actual and potential GDP is either small or nonexistent.
The aging of the capital stock, lack of new investment, and the tightening labor market indicate that resources are in short supply, which means that there is a strong probability that any semblance of robust economic growth will be accompanied by inflation. Adding to such pressure is the liquidity sloshing around the EM world. If it finds its way home, as appears to be happening, unless much of it goes into new capital formation (which is unlikely given the current regulatory and tax regimes), we are likely to see growing inflationary pressures much sooner than is currently priced into the financial markets.
Robert Barone (Ph.D., economics, Georgetown University) is a principal of Universal Value Advisors, Reno, a registered investment adviser. Barone is a former director of the Federal Home Loan Bank of San Francisco and is currently a director of Allied Mineral Products, Columbus, Ohio, AAA Northern California, Nevada, Utah Auto Club, and the associated AAA Insurance Co., where he chairs the investment committee. Contact Robert Barone or the professionals at UVA (Joshua Barone and Andrea Knapp) are available to discuss client investment needs.
Call them at 775-284-7778.
Statistics and other information have been compiled from various sources. Universal Value Advisors believes the facts and information to be accurate and credible but makes no guarantee to the complete accuracy of this information.
Permalink
January 14, 2014
Posted in Banking, Big Banks, Economic Growth, Economy, Europe, Federal Reserve, Finance, Foreign, gold, Inflation, interest rates, investment advisor, investments, Robert Barone at 6:39 PM by Robert Barone
Most seasoned investors have some allocation to precious metals in their portfolios, most often gold. They believe that such an allocation protects them, as it is a hedge, or an insurance policy, against the proliferation of paper (fiat) money by the world’s largest central banks. Fiat money is not backed by real physical assets. In concept, I agree with this sentiment. Most investors who invest in precious metals ETFs, such as the SPDR Gold Trust ETF (NYSEARCA:GLD), through the supposedly regulated stock exchanges (“paper gold”) believe that they actually have a hedge against future inflation. In what follows, I will try to explain why they may not, and why their investments in paper gold may just be speculation.
On February 5, 1981, then Fed Chairman Paul Volcker said that the Fed had made a “commitment to a monetary policy consistent with reducing inflation…” Contrast that with the statement of outgoing Fed Chairman Bernanke on December 18, 2013: “We are very committed to making sure that inflation does not stay too low…”
During 2013, the price of gold fell more than 28% (from $165.17/oz. to $118.36/oz.) despite the fact that other assets like real estate and equities each rose at double-digit rates. It is perplexing that the price of the hedge against inflation is falling in the face of a money-printing orgy at all of the world’s major central banks. Despite the fact that these central banks have fought the inflation scourge for half of a century, suddenly they have all adopted policies that espouse inflation as something desirable. The fall in the price of gold is even more perplexing because there are reports of record demand for physical gold, especially in Asia, and that some of the mints can’t keep up with the demand for standardized product. In his year-end missive, John Hathaway of Tocqueville.com says that “the manager of one of the largest Swiss refiners stated that after almost doubling capacity this year, ‘they put on three shifts, they’re working 24 hours a day…and every time [we] think it’s going to slow down, [we] get more orders…70% of the kilo bar fabrication is going to China.'”
One would also think that the price of gold should be rising because of a growing loss of confidence in fiat currencies. Here are some indicators:
The growing interest in Bitcoin as an alternative to government-issued currencies. One should ask, why did the price of Bitcoin rise from $13.51 on December 31, 2012 to $754.76 on December 30, 2013 while the price of gold fell? As you will see later in this essay, the answer lies in leverage. The gold market is leveraged; Bitcoin is not (at least, not yet).
The volatility that the Fed has caused in emerging market economies by flooding the world with dollars at zero interest is another reason the price of gold should be rising. The Fed’s announced zero-rate policy with a time horizon caused huge capital flows into emerging market economies by hedge funds looking for yield. The inflows caused disruption to the immature financial systems in those emerging markets. And then, with the utterance of a single word, “tapering,” all of the hedge funds headed for the exits at once. The Indian rupee, for example, which was trading around 53 rupees/dollar in May 2013, fell to 69 near the end of August, a 30% loss of value. Such behavior has stirred up new interest on the part of major international players (China, Russia) to have an alternative to the dollar as the world’s reserve currency. Don’t dismiss this as political posturing. It is based on irresponsible Fed policy in its role as the caretaker of the world’s reserve currency. As the world moves toward an alternative reserve currency, the dollar will weaken significantly relative to other currencies, and, theoretically, to gold (and even Bitcoin).
The loss of confidence on the part of some sovereign nations that the gold they have stored in foreign bank vaults is safe. Two examples immediately come to mind: Venezuela and Germany. In August of 2011, the President of Venezuela, Hugo Chavez, demanded that the London bullion banks that were holding Venezuela’s gold ship it to Caracas. (Again, don’t dismiss this as political posturing.) Despite the fact that the shipment could have been carried on a single cargo plane, it took until late January 2012 (17 months), for the London banks to completely comply. One should wonder why. Then, the German Bundesbank asked for an audit of its gold holdings at the Fed. One knows how the Fed has resisted audits from Congress, so why should a request from a German bank meet with any different result? After political escalation, a German minister was permitted to see a room full of gold at the New York Fed. In early 2013, the Bundesbank publicly announced that its intent was to repatriate its gold from the vaults in Paris, London, and New York. We have now learned that it will take seven years for the New York Fed to ship the gold earmarked as belonging to Germany in the Fed’s vaults. One should wonder why such a long delay.
In the face of all of this — unparalleled money printing, the rise in the prices of real estate and equities in 2013, and the creeping suspicions regarding the real value of fiat currencies — how is it that the price of gold fell 28% in 2013? The answer lies in leverage and hypothecation, the modus operandi of Wall Street, London, and financiers worldwide. The paper gold market, the one that trades the ETFs such as the SPDR Gold Trust, is 92 times bigger than the physical supply of gold according to Tocqueville’s John Hathaway. Think about that. It means that each physical ounce of gold that actually exists has been loaned, pledged, and re-loaned 92 times on average. Each holder in the paper gold market thinks that the ounce of paper gold held in the brokerage account is backed by an ounce of real gold. But there are, on average, 92 others who apparently have a claim on the same real, physical ounce.
The answer to the question, why did gold fall 28% in 2013 when, theoretically, it should have risen, is that Wall Street, London, and hedge funds have turned the paper gold market into a market of speculation, where the price rises or falls, not based on the purchasing power of currencies (the hedging characteristic of gold), but on such things as whether or not the Fed will taper, what impact Iranian nuclear talks will have on oil flows, if the interest rates in the eurozone periphery are likely to rise or fall, etc.
In my next article, I will explain how all of this occurred, and what investors who want to hedge and not speculate should do.
Robert Barone (Ph.D., economics, Georgetown University) is a principal of Universal Value Advisors, Reno, a registered investment adviser. Barone is a former director of the Federal Home Loan Bank of San Francisco and is currently a director of Allied Mineral Products, Columbus, Ohio, AAA Northern California, Nevada, Utah Auto Club, and the associated AAA Insurance Co., where he chairs the investment committee. Barone or the professionals at UVA (Joshua Barone, Andrea Knapp and Marvin Grulli) are available to discuss client investment needs.
Call them at 775-284-7778.
Statistics and other information have been compiled from various sources. Universal Value Advisors believes the facts and information to be accurate and credible but makes no guarantee to the complete accuracy of this information.
Permalink
December 27, 2013
Posted in Banking, business, Economic Growth, Economy, Federal Reserve, Finance, Housing Market, investment advisor, investment banking, investments, Markets, mortgage rates, Robert Barone at 4:41 PM by Robert Barone
Those who read our blogs know that over the past 6 months or so, we have turned positive on the underlying private sector of the U.S. economy. We have had comments from several readers about this apparent change of heart, some of them almost in disbelief. So, let us dispel any doubts. There is a huge difference between the short-term and the long-term outlooks. Let’s realize that long-term trends are just that, long-term, and that they take a long time to play out. As you will see if you read through both parts of this year end outlook, our long-term views haven’t changed. But, since the long-term doesn’t just suddenly appear, there really isn’t anything contradictory in being optimistic about the short-term. As a result, we have divided this outlook up into its two logical parts, the short-term and the long-term.
Let’s start with the short-term. First, at least through 2014 and probably 2015, the ‘fiscal drag’ that caused headwinds for the economy has now passed with the signing of the budget deal in mid-December. In his December 18th press conference, Fed Chairman Bernanke indicated that four years after the trough of the ’01 recession, employees at all levels of government had grown by 400,000; but at the same point today, that number is -600,000, i.e., a difference of a million jobs. Think of that when you think about ‘fiscal drag.’ The November jobs data shows that jobs at all levels of government have now turned positive. No matter your view of the desirability of this, those employees receive paychecks and can consume goods and services. So, from a short-term point of view, the ‘fiscal drag’ has ended, and, all other things being equal, this will actually spur the growth rate of real GDP.
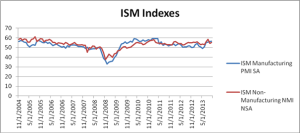
Manufacturing and Trade
The institute for Supply Management’s (ISM) indexes, both manufacturing and non-manufacturing, are as high or higher than they were in the ’05-’06 boom period. This is shown in the chart immediately below.
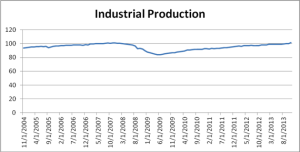
Shown in the next chart is industrial production, which in November, finally exceeded its ’07 peak.
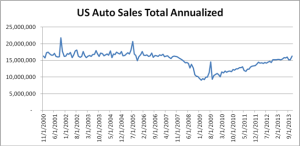
Now look below at the auto chart. Sales are as frothy today as they were in the pre-recession boom. Sales for the holiday buying period are destined to surprise to the upside.
Housing
Part of the reason that the economy is not overheating is housing. The chart clearly shows that housing starts are significantly lagging their ’05-’06 levels. But, recognize that ’05-’06 was the height of the housing bubble.
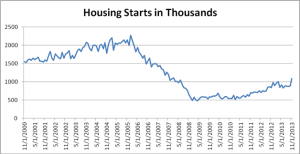
November’s housing starts surprised to the upside. But, they are still only 53% of their bubble peak. Nevertheless, because new home construction has been in the doldrums for the past six years, the resurgence evident in the economy has pushed the median price of a new home north of what it was then. In addition, the lack of construction has put the months’ supply of new homes at less than 3. In the housing bubble, when everyone was in the market, the average level of supply was 4 months. So, in some respects, the current housing market is hotter than it was at the height of the bubble. And, while interest rates have risen and are a cause for concern, they are still very low by historic standards, and we have a Fed that on December 18th recommitted to keeping them down for a period much longer than the market had anticipated.
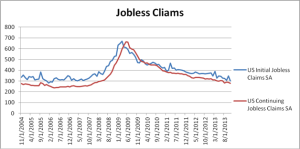
Labor Markets
Because the popular unemployment index is a lot higher today than it was in the ’05-’06 boom (7% vs. 5%), the popular media assumes that the labor markets are still loose. But, demographics and incentives to work have changed over the past seven years. The labor sub-indicators imply a much tighter labor market than the traditional unemployment index would lead one to believe. Recent new nonfarm payrolls are equivalent to their monthly gains of ’05-’06. The weekly Initial Jobless Claims number for the week ending 11/30 was 298,000. Except for one week this past September, you have to go all the way back to May ’07 to find a number that low. The first chart below shows the definite downtrend in new and continuing jobless claims.
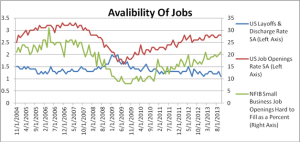
The next chart shows that layoffs and discharges are lower than they were in ’05-’06 and that both the “Job Openings” and “Jobs Hard to Fill” sub-indexes are in up trends and are approaching ’05-’06 levels.
The Aggregates
So, while auto sales are booming, the labor markets are tight, and manufacturing and services are expanding at or near boom levels, why do the aggregates (Real GDP, for example) appear so depressed? One explanation that we think has some credibility, is that there has been an expansion in the underground economy (barter; working for cash, etc.). The ‘fiscal drag’ headwinds discussed earlier, have, no doubt, had a large impact on the sluggish growth in the aggregates. On a positive note, the latest revisions to Q3 ’13 Real GDP show a growth rate of 4.1%, which, on its face, supports our short-term optimism. And until mid-December, the markets had discounted this as resulting mainly from growth in unwanted inventories. But Black Friday and Cyber Monday sales along with upbeat ongoing retail reports tell us something different, i.e., the inventory growth was not unwanted at all. While the markets expect a 2% Real GDP growth for Q4 ’13, don’t be surprised if it is much higher.
Short-term Implications
The underlying data, at least for the next 6 to 12 months, point to a strengthening economy. Certainly, a stock market correction is possible. We haven’t had one for more than 2 years. But, while possible, a significant downdraft like those of ’01 or ’09, don’t typically occur when the economy is accelerating (1987 is an exception) without an extraneous and unanticipated shock. With the signing of the first budget deal in four years, and with the Fed clearing the air about tapering and actually extending its announced period of zero interest rates, almost all of the short-term worries appear to be behind us, except one.
Inflation – The Potential Fly in the Ointment
The ‘official’ Consumer Price index (CPI) was flat in November, dominated, as it has been all autumn, by the fall back in gasoline prices. Somehow, while we all know that everyday prices are rising at a significant pace, the markets have bought into the deflation theme. Perhaps the belief is that if the markets play along with the Fed’s low inflation theme, the Fed will remain easier for longer.
In his December 16th blog, David Rosenberg (Gluskin-Sheff) has the following to say about inflation:
I have a tough time reconciling the ‘official’ inflation data with what’s happening in the real world… the .7% jump in retail sales in November on top of +.6% in October – these gains were all in volume terms? No price increases at all? Restaurants are now registering sales at a double-digit annual rate… No price increases here? The BLS tells us in the CPI data that there is no pricing power in the airline industry and yet the sector is the best performing YTD within the equity markets… global airline service fees have soared 18% in 2013… these [fees] are becoming an ever-greater share of the revenue pie and one must wonder if they are getting adequately captured in the CPI data.
Inflation could be the fly in the ointment for 2014. As long as the markets play along with the Fed’s deflation theme, as we expect they will as long as they can, the economy and markets will do just fine (this doesn’t mean there won’t be a correction in the equity markets, as we haven’t had a meaningful one for two years). But sooner, or later, something will have to be done about inflation. We will close this Part I with a quote from Jim Rogers, the commodity guru (Barron’s, October 12, 2013):
The price of nearly everything is going up. We have inflation in India, China, Norway, Australia – everywhere but the U.S. Bureau of Labor Statistics. I’m telling you, they’re lying.
December 20, 2013
Robert Barone, Ph.D.
Joshua Barone
Andrea Knapp Nolan
Dustin Goldade
Robert Barone (Ph.D., economics, Georgetown University) is a principal of Universal Value Advisors, Reno, a registered investment adviser. Barone is a former director of the Federal Home Loan Bank of San Francisco and is currently a director of Allied Mineral Products, Columbus, Ohio, AAA Northern California, Nevada, Utah Auto Club, and the associated AAA Insurance Co., where he chairs the investment committee. Barone or the professionals at UVA (Joshua Barone, Andrea Knapp and Marvin Grulli) are available to discuss client investment needs.
Call them at 775-284-7778.
Statistics and other information have been compiled from various sources. Universal Value Advisors believes the facts and information to be accurate and credible but makes no guarantee to the complete accuracy of this information.
Permalink
November 19, 2013
Posted in Banking, Big Banks, Bonds, Economy, Federal Reserve, Finance, Robert Barone, Uncategorized at 11:12 PM by Robert Barone
The Fed’s ‘Bizarro World,’ Part II

By Robert Barone, Ph.D
The “Seinfeld” TV comedy series (1989-98) had a set of episodes, known as “Jerry’s Bizarro World,” where everything “normal” was turned upside down and inside out. I have referred to this world in a previous column, and continue to find such Bizarro patterns in our real world.
The Fed was established in 1913 to act as a lender of last resort to a financial system that had been plagued with “panics” and deep recessions. At inception, its main policy tool was the “discount rate” and “discount window” where banks could submit eligible collateral to obtain needed liquidity when such options had dried up in the capital and financial markets.
Open market operations
Beginning in 1922, the Fed began to use a tool known as Open Market Operations (OMO), the buying and selling of government securities to add or subtract liquidity from the capital markets, reserves from the banking system, and to impact interest rates. OMO has traditionally been considered to be the Fed’s main policy tool. But that ended in late 2010 with the implementation of Quantitative Easing II (QE2).
In 2009, as the financial system was experiencing one of those financial panics, the Fed did what it was created to do, and provided liquidity to the markets where none was otherwise available. Many argue that Fed action via QE1 was instrumental in stabilizing the U.S. and world banking systems
Look at those excess reserves!
But, then, because the U.S. rebound from the ensuing recession was too slow, in late 2010 and again in 2012, the Fed announced more QE. Today, the latest figures show excess reserves in the banking system of $2.23 trillion. The reserves required on all of today’s existing deposits are $67 billion ($0.067 trillion). Today’s excess reserves are so massive that they can support 33 times current deposit levels without the Fed creating one more reserve dollar. Yet, with QE3, it continues to create $85 billion/month.
While they sit in an account at the Fed, excess bank reserves don’t directly influence economic activity. This, of course, has been the issue for the past five years. But, when banks do lend, the newly minted money gets into the private sector, impacting economic activity with the well-known “multiplier effect” described in money and banking textbooks. When such bank lending occurs, if the labor market is tight or there is little or no excess capacity in the business community, inflation ensues. Just think of how much money the banks can create if their current excess reserves are 33 times more than they need!
Sell side of OMO is impotent
So, how is the Fed going to control bank money creation in the future? They can’t use their most powerful traditional tool, OMO, because they would have to sell trillions of dollars of securities into the open markets before reserves would become a restricting issue for the banking system. The utterance of the word “tapering” last May sent rates up 100 basis points in a two-week period. This is just a taste of what would happen to interest rates if the Fed actually began to sell (instead of just buying a lesser amount, which is what “tapering” means).
Furthermore, long-term fiscal issues have become a real concern. With somewhere between $85 and $120 trillion of unfunded liabilities rapidly approaching as the population ages (as a comparison, annual U.S. GDP is only $16 trillion), huge fiscal deficits are a certainty barring entitlement, Social Security, Medicare and Medicaid reform. To keep the cost of the debt manageable within the U.S. government budget, the Fed must continue to keep interest rates low. With foreign criticism of U.S. policies on the rise, purchases of U.S. Treasury debt by foreign entities are likely to diminish in the future. That leaves the Fed as the major lender (lender of last resort!) to the Treasury via OMO purchases.
The borrowing window in reverse
Unable to use the “sell” side of OMO to influence the banking system, the Fed is now stuck with only one tool, the discount or borrowing window. Only now, because the financial system is drowning in the sea of liquidity, the borrowing window and discount rate must now work in reverse!
In the traditional use of the borrowing window, the Fed used the discount rate (short-term borrowing rate) to encourage (by lowering rates) or discourage (by raising rates) banks from borrowing to lend to the private sector. But, in today’s Bizarro World, the Fed will have to use the rate it pays (currently 0.25 percent/year) to the banks with excess reserves to encourage or discourage bank lending. Yes! Not the rate the banks pay to the Fed to borrow, but the rate the Fed pays to the banks to encourage them to keep their reserves instead of lending them. The original concept of the Fed as the lender of last resort has been turned on its head. It’s backward — it’s Bizarro!
Implications for investors
It is difficult for investors to deal with a system turned on its head. The bond market gets spooked whenever there is talk of the Fed “tapering” its bond purchases. The return on those bonds is simply too low for the risk involved, so the best advice here is to avoid them unless you are exceptionally skilled. That leaves equities — but that is a topic for another column in this new and Bizarro World.
Robert Barone (Ph.D., economics, Georgetown University) is a principal of Universal Value Advisors, Reno, a registered investment adviser. Barone is a former director of the Federal Home Loan Bank of San Francisco and is currently a director of Allied Mineral Products, Columbus, Ohio, AAA Northern California, Nevada, Utah Auto Club, and the associated AAA Insurance Co., where he chairs the investment committee. Barone or the professionals at UVA (Joshua Barone, Andrea Knapp, Matt Marcewicz and Marvin Grulli) are available to discuss client investment needs.
Call them at 775-284-7778.
Statistics and other information have been compiled from various sources. Universal Value Advisors believes the facts and information to be accurate and credible but makes no guarantee to the complete accuracy of this information.
Permalink
November 6, 2013
Posted in Banking, Federal Reserve, Robert Barone tagged discount rate, securities at 5:11 PM by Robert Barone
NEW YORK (TheStreet) — The Federal Reserve has strayed so far from its original mandate that its only effective policy tool, the so-called discount window, must now be used in reverse to be effective.
A brief history of the Fed shows how we got to this point.
The Fed was established in 1913 to act as a lender of last resort to a financial system that had been plagued with panics and the inevitable recessions that resulted since at least the Civil War. At the Fed’s inception, the central bank’s main policy tool was the “discount rate” and “discount window,” where banks could submit eligible collateral to obtain needed liquidity when such options had dried up in the capital and financial markets.
Early on, the Fed contemplated the use of Open Market Operations (OMO), the buying and selling of government securities in the open market to add or subtract liquidity from the banking system, which would affect interest rates. The first use of OMO occurred in 1922, and from that time on, until recently, that is, OMO was considered to be the Fed’s main policy tool. In many of today’s money and banking textbooks, you may still find such sentiment. But the era of OMO as the Fed’s major policy tool ended in late 2010 with Quantitative Easing II (QE2).
In 2009, as the financial system was experiencing one of those financial panics, the Fed did what it was created to do and provided liquidity to the markets where none was otherwise available. Many argue that Fed action via QE1 was instrumental in stabilizing the U.S. and world banking systems. QE1 provided the U.S. banking system with excess reserves — reserves in excess of those required for the existing deposit levels — of about $1 trillion.
But, then, because the U.S. rebound from the recession was too slow for the Fed, in late 2010 and again in 2012, the Fed announced more QE. Today, the latest figures show excess reserves in the banking system of $2.23 trillion. The reserves required on all of today’s existing deposits are $67 billion.
Today’s excess reserves are so massive that they can support 33 times current deposit levels without the Fed creating one more dollar. Yet with QE3, it continues to create $85 billion per month in additional excess reserves.
Excess bank reserves are called “high powered money.” While they sit in an account at the Fed, they don’t directly influence economic activity. But when banks lend, the newly minted money gets into the private sector and affects economic activity. And if there is no excess capacity in the labor or capital markets, inflation ensues.
Just think of how much money the banks can create if their current excess reserves are 33 times more than they need. Given the magnitudes here, the use of the reserve requirement policy tool to control future bank lending doesn’t appear to be feasible.
So what about the use of its most powerful traditional tool, OMO? Unfortunately, the recent overuse via QE2 and QE3 has made this tool ineffective. Imagine the Fed trying to control bank lending by reducing excess reserves. It would have to sell trillions of dollars of securities into the open markets before excess reserves would become an issue for the banking system. Where would interest rates be at that point?
Furthermore, long-term fiscal issues have become a real concern. With somewhere between $85 trillion and $120 trillion of unfunded liabilities rapidly approaching, huge fiscal deficits are a certainty barring entitlement, Social Security, Medicare and Medicaid reform.
To keep the cost of the debt manageable within the U.S. government budget, the Fed must continue to keep interest rates low. With pressures building internationally for a different world reserve currency, foreign purchases of Treasury debt may diminish in the future. That leaves the Fed as the major lender to the Treasury via OMO purchases. Trying to reduce its holdings of securities at this time would likely result in another financial panic.
Unable to use the “sell” side of OMO to influence the banking system, and unable to effectively use reserve requirements because of the magnitude of the imbalance, the Fed is now stuck with only one tool, the discount or borrowing window. Only now, because the financial system is drowning in the sea of liquidity produced by the Fed, the borrowing window and discount rate must now work in reverse.
In the traditional use of the borrowing window, the Fed used the discount rate (short-term borrowing rate to encourage (by lowering rates) or discourage (by raising rates) banks from borrowing to lend to the private sector. But now because of the volume of excess reserves created by QE2 and QE3, the Fed will have to use the rate it pays, currently 0.25%/year, to the banks with excess reserves to encourage or discourage bank lending.
Yes! Not the rate the banks pay to the Fed to borrow, but the rate the Fed pays to the banks to encourage them to keep their reserves instead of lending them.
The original concept of the Fed as the lender of last resort has been turned on its head. Instead of the private-sector banks paying to get needed liquidity, the public sector, i.e., taxpayers, will be paying the banks not to use the excess the Fed has created. It’s backward — it’s Bizarro.
Robert Barone (Ph.D., economics, Georgetown University) is a principal of Universal Value Advisors, Reno, a registered investment adviser. Barone is a former director of the Federal Home Loan Bank of San Francisco and is currently a director of Allied Mineral Products, Columbus, Ohio, AAA Northern California, Nevada, Utah Auto Club, and the associated AAA Insurance Co., where he chairs the investment committee. Barone or the professionals at UVA (Joshua Barone, Andrea Knapp, Matt Marcewicz and Marvin Grulli) are available to discuss client investment needs.
Call them at 775-284-7778.
Statistics and other information have been compiled from various sources. Universal Value Advisors believes the facts and information to be accurate and credible but makes no guarantee to the complete accuracy of this information.
Permalink
August 19, 2013
Posted in Banking, investments tagged Robert Barone, uncategorized at 10:33 PM by Robert Barone
The Seinfeld TV comedy series (1989-1998) had a set of episodes, known as Jerry’s Bizarro World, where everything “normal” was turned upside down and inside out. The Fed seems to have accomplished something similar with its experimental Quantitative Easing (QE) policies.
For the first time in a long time, underlying economic fundamentals are turning positive. Ordinarily, this would be good news for investors. But in today’s upside down, topsy turvey, bizarre markets, “good” news is bad for investors. The blame for this is squarely on the Fed’s QE policies and similar policies adopted by other central bank mimes.
The Good News
In the labor markets, job openings continue to be hard to fill (JOLTS report), layoffs and firings are at levels not seen since ’07 (Initial Jobless Claims week of August 10), and Voluntary Quits (“Take This Job and Shove It”) are rising. The consumer appears to be holding her own (retail sales) and deleveraging appears to be on its last legs (rising credit card and auto debt). Europe looks like it has bottomed (positive Q2 GDP growth) and the news from China shows higher growth levels than penciled in by the pundits. Normally, such news would be accompanied by rising equity prices. But not this time. In the U.S., the U.K., Europe, and Japan, recent positive economic data has been met with equity market sell offs. On August 15th, the Dow Jones sold off 218 points despite 5 year lows in jobless claims, a continuation of positive retail sales trends, and high and rising home builder confidence, a good leading indicator of future home sales.
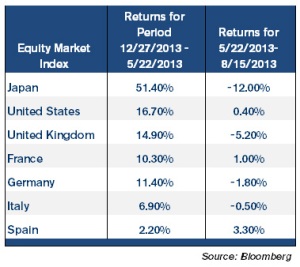
The table shows the performance of the world’s equity markets with activist central banks for the year until the Fed’s “tapering” announcement on May 22nd, and then from May 22nd to August 15th, the date of this writing. Note that until May 22nd, the markets with activist central banks performed quite well despite relatively stagnant economies, but after the “tapering” announcement, equity prices have been less than stellar. Normally, during the first signs of a change in policy toward tightening, what we find is both rising interest rates and rising stock prices because monetary policy tightening means a strengthening economy.
The Bizarro World
David Patterson of Brandywine Trust Group, in an August 15 Wall Street Journal piece, opined that markets no longer move on fundamental economic data, but on anticipated Fed policy moves. In fact, it isn’t so much the policy change itself that moves the markets, but whether or not that change was more or less than anticipated (i.e., the 2nd derivative).
Patterson’s premise is that the market knows that the Fed is counting on the “wealth effect,” via a rise in equity prices, to have an impact on consumption, and anticipates and discounts Fed actions to achieve that “wealth effect.” If the Fed acts (or fails to act), and its actions (or lack thereof) disappoint market expectations, equity prices react negatively. As a result, because “good” fundamental economic data means a stronger economy and less need for monetary accommodation, we now have the bizarre world where “bad” fundamental economic news moves the markets higher, while “good” news does the opposite. That is, “bad” is now “good,” and “good” is “bad.” Patterson sums up the Fed’s Bizarro World as follows.
The process can at some point turn powerfully negative, if the monetary stimulus stops, or is expected to stop, or becomes ineffective, which it will if it is expected to become ineffective, because it is only effective based on what the market expects. (emphasis added)
There are no special attributes of wisdom that are automatically imparted to the Fed’s Chair at his/her swearing in ceremony. The non-traditional policies adopted by the Bernanke Fed, and mimicked by other major central banks, are experimental. Going in, they did not know what the unintended consequences would be. But now we are getting a glimpse. At this writing, we do not know how the Fed’s September decision about the “tapering” of its QE program will impact the equity markets. Will it disappoint, or not? But, what we do know is that in the Fed’s new bizarro world, whatever that decision may be, and whether it disappoints market expectations or not, market reaction will not be tied to economic reality.
Robert Barone (Ph.D., economics, Georgetown University) is a principal of Universal Value Advisors, Reno, a registered investment adviser. Barone is a former director of the Federal Home Loan Bank of San Francisco and is currently a director of Allied Mineral Products, Columbus, Ohio, AAA Northern California, Nevada, Utah Auto Club, and the associated AAA Insurance Co., where he chairs the investment committee. Barone or the professionals at UVA (Joshua Barone, Andrea Knapp, Matt Marcewicz and Marvin Grulli) are available to discuss client investment needs.
Call them at 775-284-7778.
Statistics and other information have been compiled from various sources. Universal Value Advisors believes the facts and information to be accurate and credible but makes no guarantee to the complete accuracy of this information.
Permalink
August 16, 2012
Posted in Banking, Economy, Europe, Federal Reserve, Finance, Foreign, investment banking, investments, Italy, Spain, Uncategorized tagged advisor, ancora west, ancora west advisors, Bob Barone, economics, Federal Reserve, Finance, financial adviser, nevada, Robert Barone at 8:45 PM by Robert Barone
The Past
The stock market always has been considered a “leading” They are “administered” by central banks (the Fed, the European Central Bank, the Peoples’ Bank of China, the Bank of Japan, etc.), which set and manipulate the rates. When interest rates are determined by other than market forces, you can be assured that scarce resources are inefficiently allocated. We need only look to the long period of administered artificially low rates under the Greenspan Fed to realize that such a policy was a major contributor to the housing bubble last decade.
Expectations
Given the recent collapse in basic, fundamental worldwide economic activity (consumption, orders, employment), one must be skeptical of an equity market that continues to, apparently, defy gravity. Investors, or more accurately, speculators, await the next Fed or ECB policy-easing move, not wanting to “miss” the inevitable market updraft that they hope occurs. (Of course, they could be hugely disappointed, as were the initial investors in Facebook!) Could it be that market expectations of such moves already have driven prices up, and the policy-easing moves themselves will be anticlimactic? In market parlance, this is known as “buy the rumor, sell the fact.”
Recent market reactions
Sooner or later, markets will come back to valuations based on the underlying fundamentals. This isn’t the first time that the markets have exhibited extreme sentiment. And it won’t be the last. So, let’s examine some of the recent “policy” issues and data releases in light of market sentiment.
• On July 26, ECB President Mario Draghi (“Super Mario”) said, “Within our mandate, the ECB is ready to do whatever it takes to preserve the euro,” adding later, “Believe me, it will be enough.” The market interpreted this as a pledge that the ECB would directly purchase the debt of Spain and Italy, thus reducing pressure on interest rates in those countries. The Dow Jones rose 3.2 percent during the next two days. On Aug. 2, when the ECB met and didn’t announce
anything major, the Dow sold off .7 percent, only to begin a rise again on Aug. 3 when the market realized that Spanish and Italian two-year rates, which is where those two countries are selling new debt, were now falling. Apparently, the markets now believe Super Mario’s words.
Nevertheless, no amount of liquidity can resolve the solvency problem that exists in Europe’s southern nations. No matter what these politicians do, short of an unlikely fiscal union, the euro will be pulled apart. The northern countries — Finland, Denmark, Germany — have attitudes toward work, debt, inflation and socialism that are diametrically opposed to the attitudes in the Mediterranean countries.
So, Europe likely is to remain in a recessionary/slow growth mode for the foreseeable future, and debt issues there will continue to impact capital markets worldwide.
• On July 27, the Department of Commerce’s Bureau of Economic Analysis reported that the real GDP grew at an annual rate of 1.5 percent in the second quarter. (The measurement methodology of the price deflator is questionable as it biases the real GDP number significantly upward. While every other indicator of economic activity is declining, it doesn’t seem logical that this one is rising.)
The markets had expected a worse report, and breathed a sigh of relief, advancing 188 Dow points that day (1.5 percent). But, even a cursory analysis of the underlying data reveals that the private sector remains in stagnation. In the second quarter, nominal dollar GDP grew by $117.6 billion or by $1.29 billion/day. However, the federal government added $274.3 billion in new debt ($3.01 billion/day). Thus, it took $2.33 of new debt to increase GDP by $1. Would anyone in their right mind sign up for a loan of $233,000 if the lender was only going to fund $100,000?
• The Aug. 3 employment report was “stronger” than expected, according to the media, with the Establishment Survey showing new job growth of 163,000. (June’s 80,000 job growth was revised downward to 60,000.) The headline “unemployment rate” went up to 8.3 percent. It was widely reported that the rise of the unemployment rate was due to the fact that fewer people were discouraged and more people entered the labor force. After all, how else could the unemployment rate rise when 163,000 jobs were created? The answer is, after all these years, the media doesn’t know that the headline unemployment rate is calculated using a completely different survey. The Establishment Survey queries 141,000 businesses, while the Household Survey queries 60,000 households. The Establishment Survey adds in a residual factor of about 50,000 jobs per month, created out of nowhere, from what is known as the birth-death model (the BEA assumes 50,000 more new small businesses are created every month than are closed; this is clearly an historical artifact and doesn’t exist in today’s world, but it is still added to the data). The Household Survey actually showed a decline of 195,000 jobs (all of which were full-time jobs) in July, and because the labor force declined by 150,000, the unemployment rate went up. The labor market is nowhere near healthy.
As I said earlier, sooner or later, the markets will come back to what the fundamentals say. I don’t know when that will occur, perhaps after the elections, or maybe not until sometime in 2013, depending on who wins. As I said in a previous column, policy issues are important for markets. Clearly, today, policy appears to be not only the most important factor but the only factor.
Because sentiment on Wall Street can change in an instant, investors should remain very cautious. Depending on your own situation, perhaps some profit taking is now in order. Short duration bonds continue to look safe given current underlying economic conditions and likely policy moves.
Robert Barone (Ph.D., Economics, Georgetown University) is a Principal of Universal Value
Advisors (UVA), Reno, NV, a Registered Investment Advisor. Dr. Barone is a former Director of the Federal Home Loan Bank of San Francisco, and is currently a Director of Allied Mineral Products, Columbus, Ohio, AAA Northern California, Nevada, Utah Auto Club, and the associated AAA Insurance Company where he chairs the Investment Committee.
Information cited has been compiled from various sources which UVA believes to be accurate and credible but makes no guarantee as to its accuracy. A more detailed description of the company, its management and practices is contained in its “Firm Brochure” (Form ADV, Part 2A) which may be obtained by contacting UVA at: 9222 Prototype Dr., Reno, NV 89521. Ph: (775) 284-7778.
Permalink
July 27, 2012
Posted in Banking, Bankruptcy, Economy, Europe, Finance, greece, Spain tagged adviser, advisor, ancora west, ancora west advisors, Bob Barone, consumer debt, devaluing US dollar, economic policy, European Financial Stability Facility, nevada, Recession, Robert Barone at 8:49 PM by Robert Barone
The term “European Theater” was first coined during World War II. Today in the financial markets, the term has come to symbolize an ongoing soap opera, where the audience is continually held in suspense as the bad actors (the politicians) promise actions and solutions to current crises, which have been created by their prior actions. Each time solutions are proposed, the audience breathes a sigh of relief (i.e., relief rally in the equity markets) only to be disappointed when they find out that the solutions won’t work or can’t be implemented.
As a result, the crisis and suspense continues, keeping the audience’s total attention (even while dinner on the stove at home is burning). Meanwhile, a new issue or crisis appears, it seems, on a daily basis.
Likely New Episodes
Daily we watch yields on Spanish and Italian debt move ever higher, now in zones where other countries have cried “uncle” and asked for bailout help. At the same time, the credit default swaps on Spanish and Italian debt have risen to record levels.
New Episode: Will the capital markets force a Spanish bailout by locking Spain out of the debt markets?
- Spanish bank recapitalization: We have recently learned that the European Central Bank is willing to impose losses on the shareholders and junior bondholders of some of the Spanish savings banks. (When they bailed out Ireland, all bondholders were saved.) The draft of the document meant to give Spain’s banks 100 billion euros has this provision, but the periphery’s finance ministers are opposing it.
- New Episode: Is 100 billion euros enough for Spain’s banks? The general rule of thumb appears to be that the ultimate amount needed is usually higher by a factor of at least two.
- Spain’s regional provinces are now coming hat in hand for bailouts of their own. And those regional governments must refinance more than 35 billion euros in the near future.
- New Episode: Are there enough resources in the European Financial Stability Facility (EFSF), the temporary bailout fund, and the European Stability Mechanism (ESM), the proposed permanent bailout fund, to bail out Spain and its regions? What about Italy?
- The problematic link between Spain’s sovereign and its bank’s balance sheets has not been severed, as the audience was led to believe during the “Summit” episode.
- New Episode: Will the ESM require the Spanish government to guarantee the bank capital? If so, will market reaction drive borrowing rates for Spain even higher, or lock them out of the capital markets altogether?
- Greece now appears unable to produce an austerity plan acceptable to the Troika (EU Commission, ECB and International Monetary Fund). Greece has a 3.8 billion euro bond payment due in August. And the ECB just announced that it will no longer accept Greek government bonds as collateral for loans, thus locking Greece out of ECB borrowing.
- New Episode: Will the Troika impose its own plan, or will it withhold bailout funding? Without access to the ECB, will Greece default again? And, will this lead to Greece’s immediate and disorderly exit from the monetary union?
- Each monetary union country is required to put capital into the ESM. Italy will be required to pony up 20% of the ESM capital.
- New Episode: What sense does it make for Italy to borrow at 7% when the ESM would offer a rate of return that is closer to 3%?
- The ECB holds tons of Greek debt on their balance sheet at par (i.e., 100% of face value) (Portuguese, Spanish and Italian debt, too). If (when) Greece leaves the monetary union, they will renounce this debt, causing the ECB to need more capital to cover this loss.
- New Episode: Will the remaining members be able to contribute even more capital? That will put additional pressure on the weaklings — again, Portugal, Spain and Italy will have to go to the capital markets to borrow at extremely high rates to meet their capital contribution requirements.
- Will the ESM be allowed to purchase sovereign debt in the secondary market as promised in the “Summit” episode? This is meant to support Spain and lower the interest rate it has to pay to borrow. The Dutch, Finns and probably the Germans may say ‘Nein.’
Politicians in a Box
The bad actors in this soap opera, the politicians, know that if they attempt to do the right thing, they will be voted out of office by populations who value their entitlements more than anything else. Look at Greece and the near victory by the Syriza party (anti-austerity) in the last set of elections. And now, we see riots in Spain.
These bad actors have proposed so-called “fixes” that merely kick the can down the road, from bailouts (Greece, Portugal, Spain, Ireland) to a banking union in order to avoid addressing the core issues. The fixes enacted calm the audience for shorter and shorter periods. For example, the deposit flight from Spain’s banks now continues unabated, despite the capital plan for Spanish banks announced during the recent “Summit”.
This soap opera will continue to play out because liquidity does not produce solvency. The ECB and politicians can throw all of the money they can create at the problem, but, until debt restructuring occurs (i.e., dealing with the debt), the soap opera will continue. Debt restructuring means that some lenders won’t get repaid at all and others will have to take a haircut. Inevitably, some financial institutions (i.e., lenders) will fail. The game to keep them alive cannot go on forever.
Eventually, the markets will tire of the soap opera, lose confidence (as they appear to be doing), and close the capital market to these players. It would be much better to have an orderly restructuring than a disorderly one imposed by a panicky market. But, so far, no European leader has stepped up with such a plan (i.e., a plan to exit the weaklings from the monetary union).
Without such a plan, the stronger European nations (like Germany, Finland and The Netherlands) will soon have had enough and will leave the monetary union on their own, most likely, to go back to their old currencies.
The Final Episode?
It appears that many of the New Episodes described above will soon play out as the situation appears to be in endgame mode. Some sort of resolution acceptable to the capital markets is being demanded by those very markets. The roller coaster is at full speed and it appears the tracks are about to end.
What new games can the European politicians play to buy more time? Is there anything they can do, short of having a plan to exit the southern weaklings that can now save the euro? What can they do now to even buy more time?
Unfortunately, it appears that a market-imposed resolution, which means market panic and financial chaos for Europe with grave worldwide implications, is rapidly approaching.
Robert Barone (Ph.D., Economics, Georgetown University) is a Principal of Universal Value
Advisors (UVA), Reno, NV, a Registered Investment Advisor. Dr. Barone is a former Director of the Federal Home Loan Bank of San Francisco, and is currently a Director of Allied Mineral Products, Columbus, Ohio, AAA Northern California, Nevada, Utah Auto Club, and the associated AAA Insurance Company where he chairs the Investment Committee.
Information cited has been compiled from various sources which UVA believes to be accurate and credible but makes no guarantee as to its accuracy. A more detailed description of the company, its management and practices is contained in its “Firm Brochure” (Form ADV, Part 2A) which may be obtained by contacting UVA at: 9222 Prototype Dr., Reno, NV 89521. Ph: (775) 284-7778.
Permalink
July 9, 2012
Posted in Banking, Big Banks, debt, Economic Growth, Economy, Europe, Federal Reserve, Finance, government, greece, Housing Market, International Swaps and Derivatives, investment advisor, investment banking, investments, Italy, recession, sovereign debt, Spain, taxes, Unemployment tagged advisor, ancora west, ancora west advisors, Banking, Ben Bernanke, Bob Barone, consumer debt, consumption, Debt, devaluing US dollar, economic policy, economics, fair value, Federal Reserve, Finance, financial adviser, Inflation/Deflation, nevada, Obama, Recession, Robert Barone, small business, taxpayer, too big to fail, U.S. Treasury, unemployment at 3:17 PM by Robert Barone
This is a mid-year overview of the economic and policy issues in the U.S. and worldwide, both positive and negative. I have divided the issues into economic and policy issues. With enough political will, policy issues can be addressed in the short run, while economic issues are longer-term in nature and are clearly influenced by policy.
Positives
• Cheap energy (economics and policy): There is growing recognition that cheap energy is key to economic growth; the next boom will be based on cheap energy.
• Manufacturing (economics): After years of decline, American manufacturing is in a renaissance, led by the auto industry.
• Corporate health (economics): Large corporations are extremely healthy with large cash hoards and many have low cost and low levels of debt.
• Politics (policy): Americans are tired of special interests’ ability to pay for political favors.
• Recession in Europe (economics): This has implications for world growth because Europe’s troubled banks are the engines of international lending; Europe’s economy rivals that of the U.S. in size.
• European Monetary Union (policy): A Greek exit from the euro is still probable after recent election and is likely to spread contagion to Portugal, Spain and even Italy. There is also danger here to America’s financial system.
• Brazil, Russia, India, China or the BRIC, Growth Rate (economics): China appears to be in danger of a hard landing, as is Brazil. India is already there. This has serious implications for commodity producers like Canada and Australia.
• Fiscal cliff and policy uncertainties (policy): A significant shock will occur to the U.S. economy if tax policy (Bush tax cut expiration and reinstatement of the 2 percent payroll tax) isn’t changed by Jan. 1, 2013.
• Entitlements (policy): Mediterranean Europe is being crushed under the burden of entitlements; the U.S. is not far behind. This is the most serious of the fiscal issues but the hardest for the political system to deal with.
• Housing (economic & policy): In the U.S., housing appears to have found a bottom, but because of falling prices and underwater homeowners, a significant recovery is still years away. Housing is a huge issue in Europe, especially Spain, and it will emerge as an issue in Australia and Canada if China has a hard landing.
• Energy costs (economics & policy): The current high cost of energy is killing worldwide growth (see “Positives” above).
• U.S. taxmageddon (policy): The U.S. tax system discourages savings and investment (needed for growth), encourages debt and favors specific groups.
• Too Big To Fail (TBTF) (policy): The U.S. financial system is dominated by TBTF institutions that use implicit government backing to take unwarranted risk; TBTF has now been institutionalized by the Dodd-Frank legislation; small institutions that lend to small businesses are overregulated and are disappearing.
• Debt overhang (economics): The federal government, some states and localities and many consumers have too much debt; the de-leveraging that must occur stunts economic growth.
• Inflation (economics & policy): Real inflation is much higher than officially reported. If a true inflation index were used, it is likely that the data would show that the recession still hasn’t ended.
It is clear from the points above and from the latest data reports that worldwide, most major economies are slowing. It is unusual to have them all slowing at the same time and thus, the odds of a worldwide recession are quite high.
In the context of such an event or events, the U.S. will likely fare better than most. But that doesn’t mean good times, just better than its peers. There is also greater potential of destabilizing events (oil and Iran, contagion from Europe, Middle East unrest), which may have negative economic impacts worldwide. Thus, in the short-term it appears that the U.S. economy will continue its lackluster performance with a significant probability of an official recession and vulnerable to shock type events. (Both the fixed income and the equity markets seem to be signaling this.)
The extension of Operation Twist by the Federal Reserve on June 20 (the Fed will swap $267 billion of short-term Treasury notes for long-term ones through Dec. 31 which holds long-term rates down) was expected, and continues the low interest rate policy that has been in place for the past four years. That means interest rates will continue to remain low for several more years no matter who is elected in November. Robust economic growth will only return when policies regarding the issues outlined in the table are addressed.
Looking back at my blogs over the years, I have always been early in identifying trends. The positive trends are compelling despite the fact that the country must deal with huge short-term issues that will, no doubt, cause economic dislocation.
The only question is when the positives will become dominant economic forces, and that is clearly dependent on when enabling policies are adopted. 1) In the political arena, there is a growing restlessness by America’s taxpayers over Too Big To Fail and political practices where money and lobbyists influence policy and law (e.g., the Taxmageddon code). 2) The large cap corporate sector is healthier now than at any time in modern history. Resources for economic growth and expansion are readily available. Only a catalyst is needed. 3) America is on the “comeback” trail in manufacturing. Over the last decade, Asia’s wages have caught up.
Cultural differences and expensive shipping costs are making it more profitable and more manageable to manufacture at home. 4) Finally, and most important of all, unlike the last 40 years, because of new technology, the U.S. has now identified an abundance of cheaply retrievable energy resources within its own borders. As a result, just a few policy changes could unleash a new era of robust economic growth in the U.S. Let’s hope those changes occur sooner rather than later!
Robert Barone (Ph.D., Economics, Georgetown University) is a Principal of Universal Value
Advisors (UVA), Reno, NV, a Registered Investment Advisor. Dr. Barone is a former Director of the Federal Home Loan Bank of San Francisco, and is currently a Director of Allied Mineral Products, Columbus, Ohio, AAA Northern California, Nevada, Utah Auto Club, and the associated AAA Insurance Company where he chairs the Investment Committee.
Information cited has been compiled from various sources which UVA believes to be accurate and credible but makes no guarantee as to its accuracy. A more detailed description of the company, its management and practices is contained in its “Firm Brochure” (Form ADV, Part 2A) which may be obtained by contacting UVA at: 9222 Prototype Dr., Reno, NV 89521. Ph: (775) 284-7778.
Permalink
Next page


